The precipitation, temperature, evapotranspiration, and groundwater data can be added to the model. Those climate data will first be added to the Resource Library and then added from Resource Library to Project Manager.
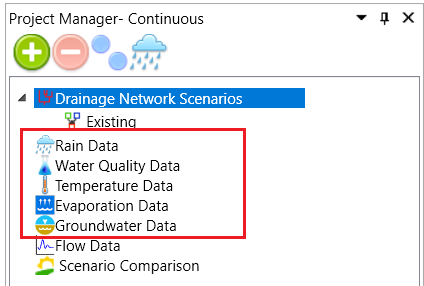
Click Project Manager tab, so later on we can see how the climate data are added from Resource Library to Project Manager. By now, the climate data group in your Project Manager should be empty.
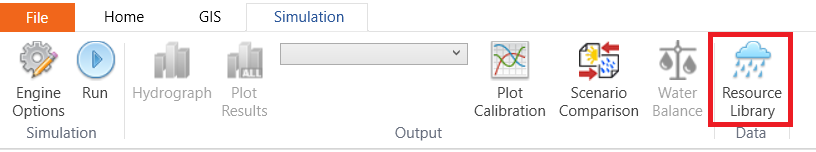
To open Resource Library click the Resource Library button under the Simulation toolbar.
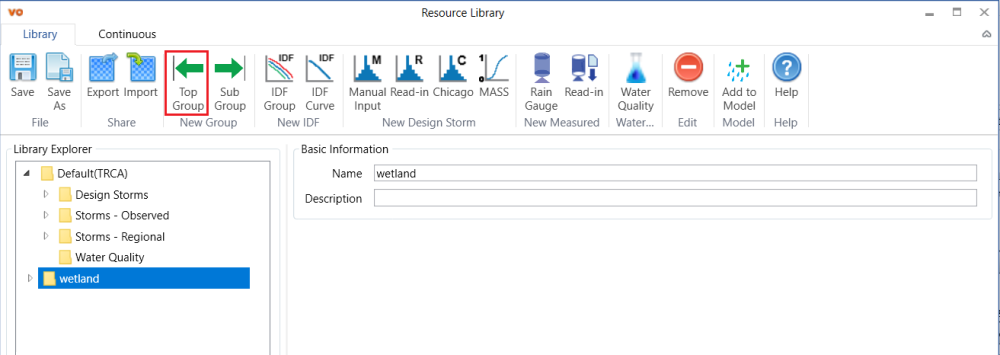
Create a new Top Group and name it as “wetland”.
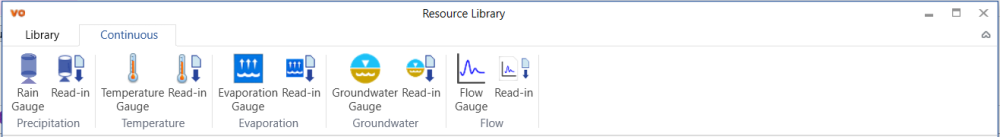
Under this group, we will add Precipitation, Temperature, Evapotranspiration, and Groundwater data. Those data types can be found under the Continuous tab of Resource Library.
Add precipitation data
Add a new Rain Gauge by clicking the Rain Gauge button  under the Continuous tab. Change the Name of rain gauge to “rain”.
Then click the Read In button  in the Precipitation section of the Continuous tab to pop up the New Monitored Storm – From File window. In the pop-up window, click Browse…. Navigate to and open the rain data “…\data\Hourly_Precip_Filled.csv”. Click OK to close the New Monitored Storm – From File window and add the data to Resource Library.
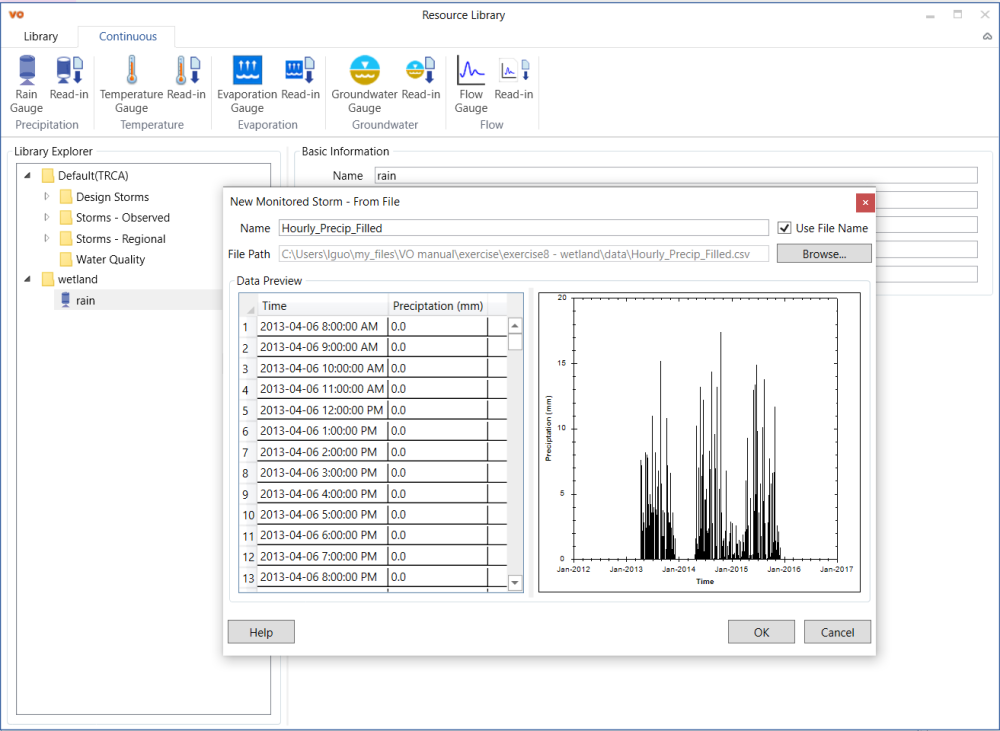
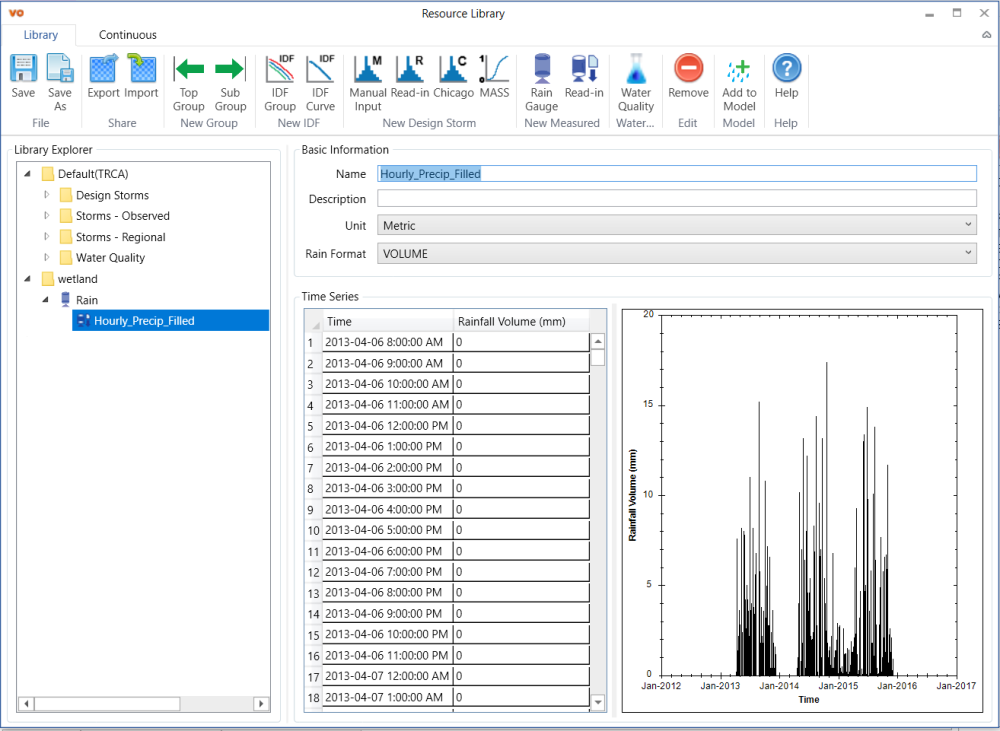
Keep the added rain data “Hourly_Precip_Filled” highlighted and in the Basic Information section, change the Rain Format to Volume and make sure Unit is in Metric.
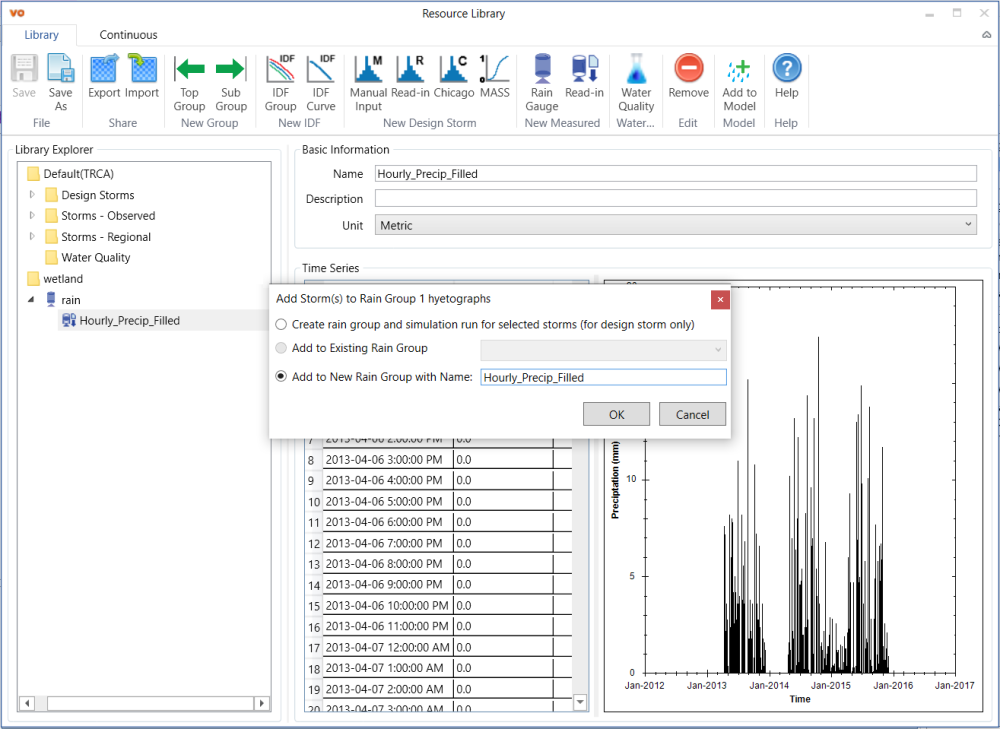
Right-click it to open the context menu and select Add to Model…. In the pop-up window, select Add to New Rain Group with Name and title the rain group “Hourly_Precip_Filled”. Click OK. The precipitation data will be added to the Rain Data group in the Project Manager.
Add temperature data
Add a new Temperature Gauge by clicking the Temperature Gauge button  under the Continuous tab. Change the Name of temperature gauge to “temp”.
Then click the Read In button  in the Temperature section of the Continuous tab to pop up the New Monitored Temperature – From File window. In the pop-up window, click Browse…. Navigate to and open the temperature data “…\data\temp_daily_max_min.csv”. Click OK to close the New Monitored Temperature – From File window and add the data to Resource Library.
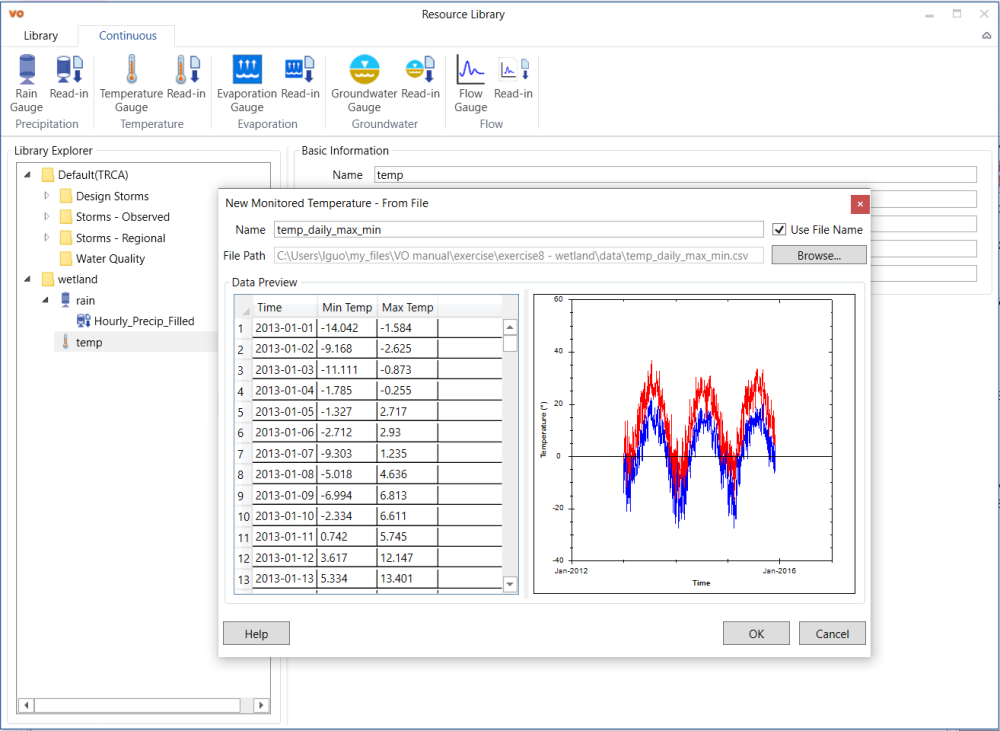
Keep the added temperature data “temp_daily_max_min” highlighted. Right-click it to open the context menu and select Add to Model…. The temperature data will be added to the Temperature Data group in the Project Manager.
Add evaporation data
Follow the similar procedure as adding rain and temperature data to add evaporation gauge and read-in data. Add evaporation gauge by clicking Evaporation Gauge  and Name it as “pet” . Click Read-In
  buttons in the Evaporation section of Continuous tab to add the evaporation data at “…data\PET_Hargreaves.csv”.
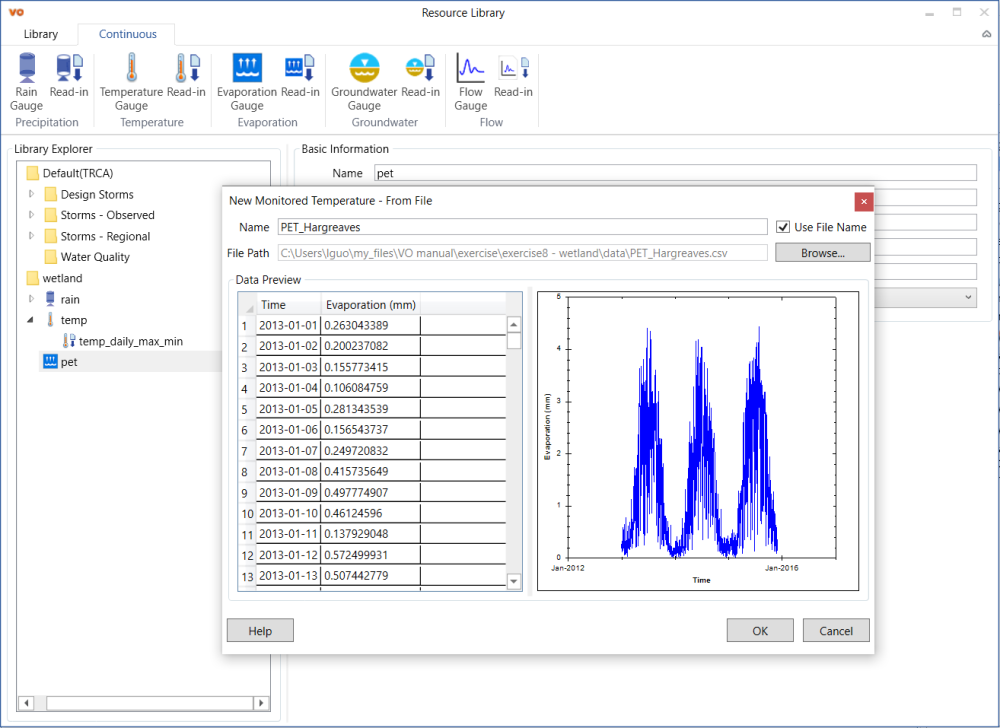
Keep the added evaporation data “PET_Hargreaves” highlighted. Right-click it to open the context menu and select Add to Model…. The evaporation data will be added to the Evaporation Data group in the Project Manager.
Add groundwater data
Follow the similar procedure as adding rain, temperature and evaporation data to add groundwater gauge and read-in data. We will add three sets of groundwater data, respectively for year 2013, 2014 and 2015.
Add groundwater gauge by clicking Groundwater Gauge  and Name it as “GW”. We will add three groundwater datasets to this top-group. Click Read-In
  buttons in the Groundwater section of Continuous tab to add the groundwater data at “…data\GW40-1m-1-2013.csv”.
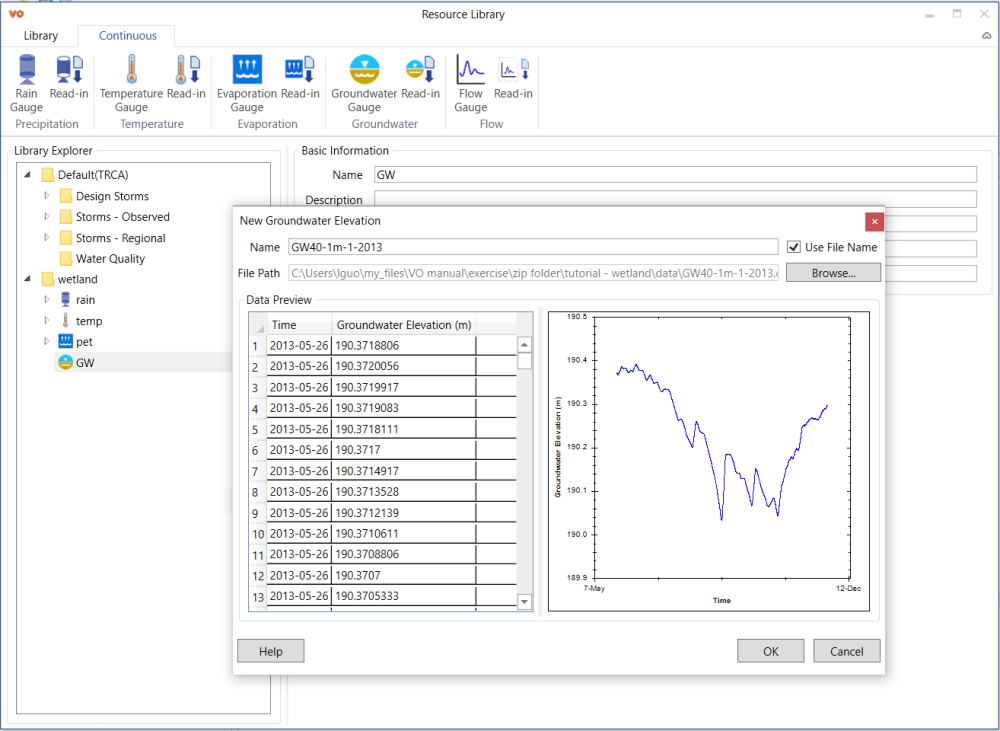
Keep the added evaporation data “GW40-1m-1-2013” highlighted. Right-click it to open the context menu and select Add to Model…. The groundwater data will be added to the Groundwater Data group in the Project Manager.
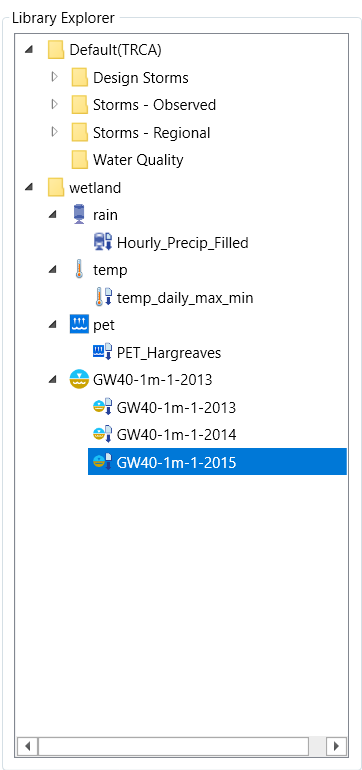
Follow the same way to add the groundwater Read-in data for years 2014 and 2015 and add them to model. The CSV files of those two years’ groundwater data are in the same folder as “GW40-1m-1-2013.csv”, but named as “GW40-1m-1-2014.csv” and “GW40-1m-1-2015.csv”. The Library Explorer of the Resource Library should look like the figure below.
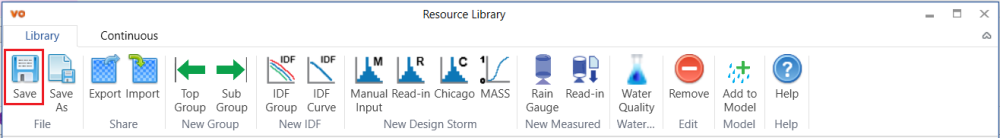
Save and close Resource Library
Click Save button in the Library tab and close Resource Library window.
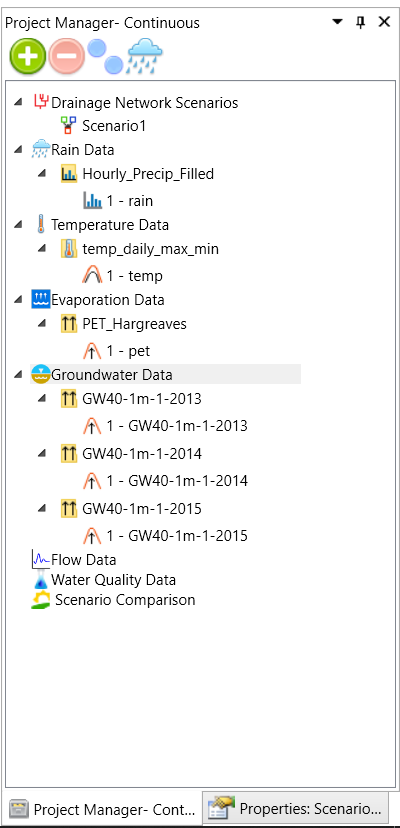
In the Project Manager tab, you should be able to see the climate data under each climate data group.