
In this study design storm and historic storm flows were generated on large rural watersheds. The results from the historic storm events were examined to determine if the peak intensity or the antecedent moisture conditions influence the flows on a rural catchment. The peak intensity was found to be independent of the peak flows as shown in the figure below. On the other hand, the antecedent moisture conditions, as measured by the API, are correlated with the peak flows. The correlation coefficient between the API and the peak flows is close to 1.
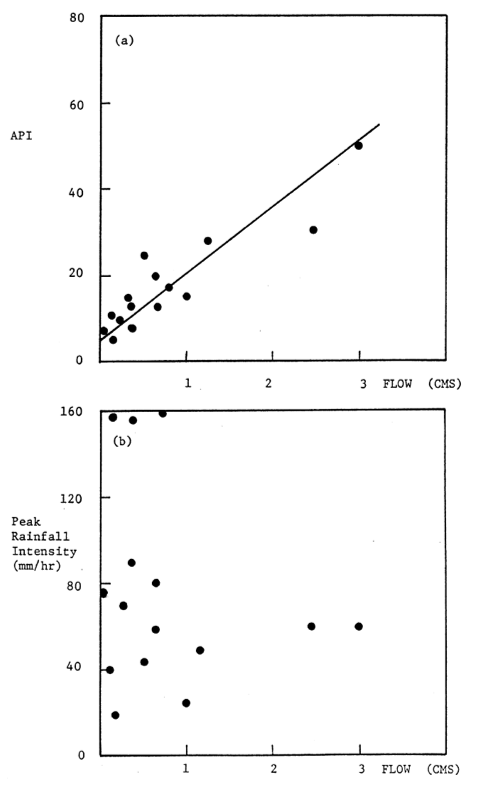
RURAL AREAS (a) CORRELATION BETWEEN API AND PEAK FLOWS (b) CORRELATION BETWEEN PEAK RAINFALL AND FLOWS
The flow frequency curves for the large rural watershed is shown in the figure below. The SCS 24-hour design storm flows are greater than those given by the real storm series. On the large rural water-shed, in Southern Ontario, the flows are overestimated by 5% to 10%.
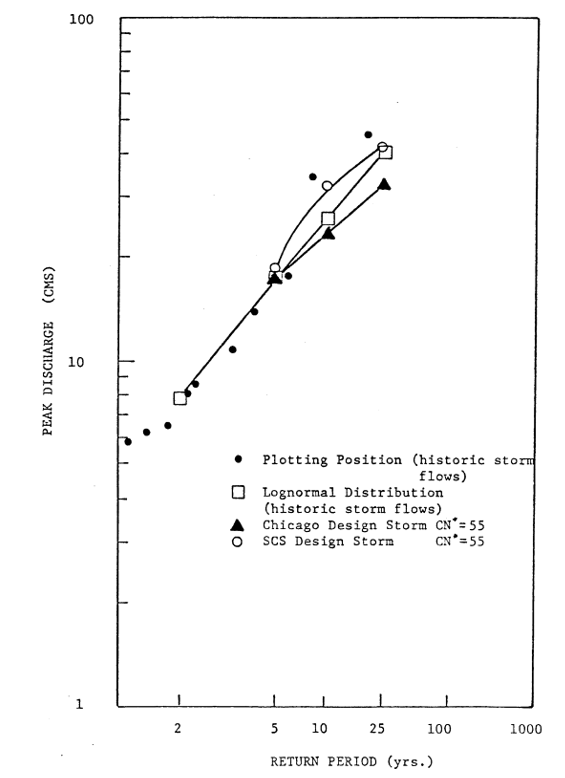
FLOW FREQUENCY CURVES FOR A RURAL WATERSHED IN SOUTHERN ONTARIO
Using the SCS 24-hour design storm with an average CN* resulted in flow frequency curves slightly larger than-the historic storm series flows on the rural watersheds.
The Chicago design storm was also tested on these catchments. It had a shorter duration than the SCS 24-hour storm but a higher peak intensity. The Chicago design storm gave lower flows than those from the historic storm series. The flows on the southern Ontario watershed were from 2.9% to -27.3% different from the historical storm flows. On the small rural watershed, the 100 yr. Chicago and SCS 24-hr. design storms gave almost identical peak flows. The flows were 1.28 cms and 1.37 cms respectively. The Chicago design storm flows produced lower flow frequency curves than the historic storm series flows on the rural watersheds.
This comparison of the design storm flows on the rural watersheds shows that the SCS 24-hour design storm gives a good prediction of the peak flow frequency curves. The importance of antecedent moisture conditions in determining the peak flow was also demonstrated. On rural catchments the OTTHYMO model uses an average CN* with the design storm. This was found to give good predictions of the peak flow when used in conjunction with the SCS 24-hour design storm.