
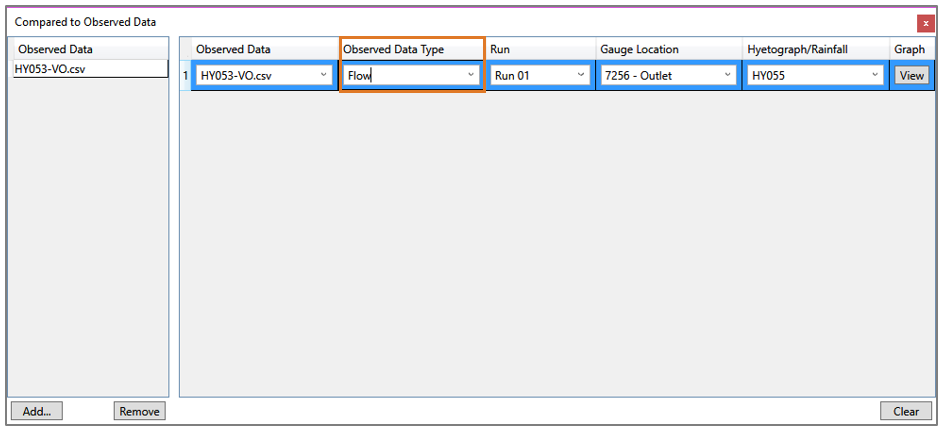
Similar to the single-event simulation, it is important to compare the observed and simulated time-series data for model calibration. For file format, please refer to 10.3 Calibration Files. As there are more than one time-series data available, it is necessary to specify which time series to use for the comparison. This is done by selecting the Observed Data Type in the Calibration window as shown in the figure below. The two options are Flow and Water Level in the current version.
As the time series data may have multiple events, besides the same normal statistical values that are used to evaluate the agreement of the observed and simulated data in the event-based simulation, two other statistical values are provided: ![]() and Nash-Sutcliffe Coefficient (NSE). A value close to 1 indicates a good match. These two statistical values update automatically when the plot area is zoomed in or out.
and Nash-Sutcliffe Coefficient (NSE). A value close to 1 indicates a good match. These two statistical values update automatically when the plot area is zoomed in or out.

For wetlands, this plot calibration window provides the modeled vs observed water levels in the storage portion of the wetland and includes a blue line which shows the groundwater elevation. The statistics at the bottom of the screen includes a % difference as well as the ![]() and Nash-Sutcliffe Coefficient. These values are provided at daily, weekly and monthly intervals for the time range shown on the graph.
and Nash-Sutcliffe Coefficient. These values are provided at daily, weekly and monthly intervals for the time range shown on the graph.
