
A hydrograph is the main output in VO. It can be viewed by graph, table, summary text and label.
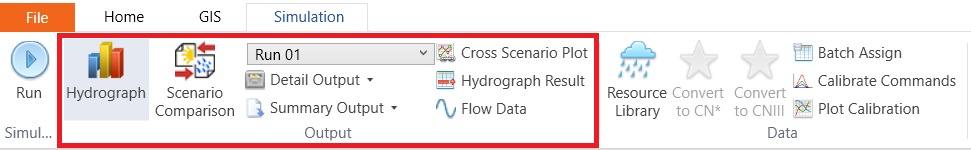
Select the AddHyd located at the outlet on the Canvas. Notice that the buttons located at the Output section in the Simulation ribbon are enabled. All these buttons are used to view results in a different format.
- The Hydrograph button
![]() gives the hydrograph graph. The hyetograph is shown on the top. Multi-graph can be shown here for comparison.
gives the hydrograph graph. The hyetograph is shown on the top. Multi-graph can be shown here for comparison.
![]()
- The Flow Data button
![]() gives the hydrograph table.
gives the hydrograph table.
![]()
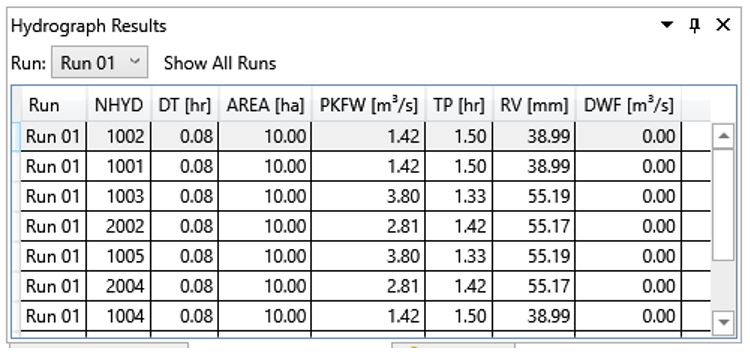
- The Hydrograph Result button
![]() gives a summary of the hydrograph in table format.
gives a summary of the hydrograph in table format.
![]()
The same information is also shown in the Hydrograph Results window at the bottom of the application window.
![]()
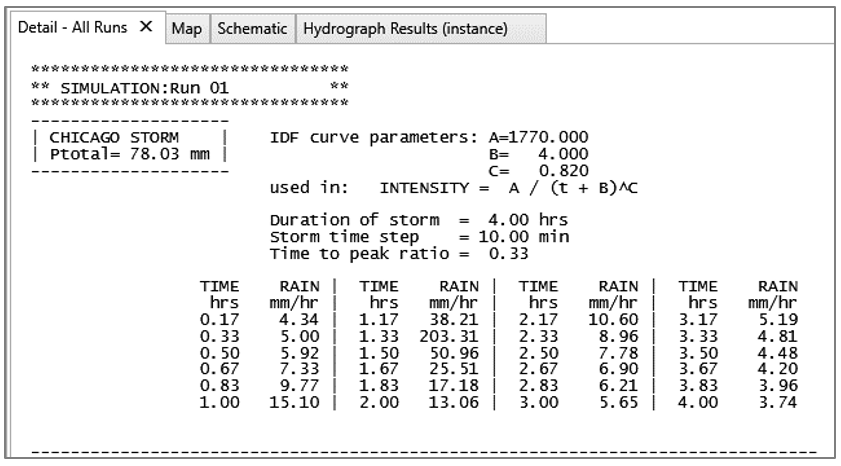
- The Detail Output button
![]() gives the detailed text output.
gives the detailed text output.
![]()
Note that information shown is dependent on the selected hydrologic objects. The detail information for NasHyd 1002 is shown below.
![]()
- The summary output button gives a summary text output of AddHyd 9.
![]()
The output is dependent on the type of hydrologic object. For NasHyd 1002, the output is similar the one show below.
![]()
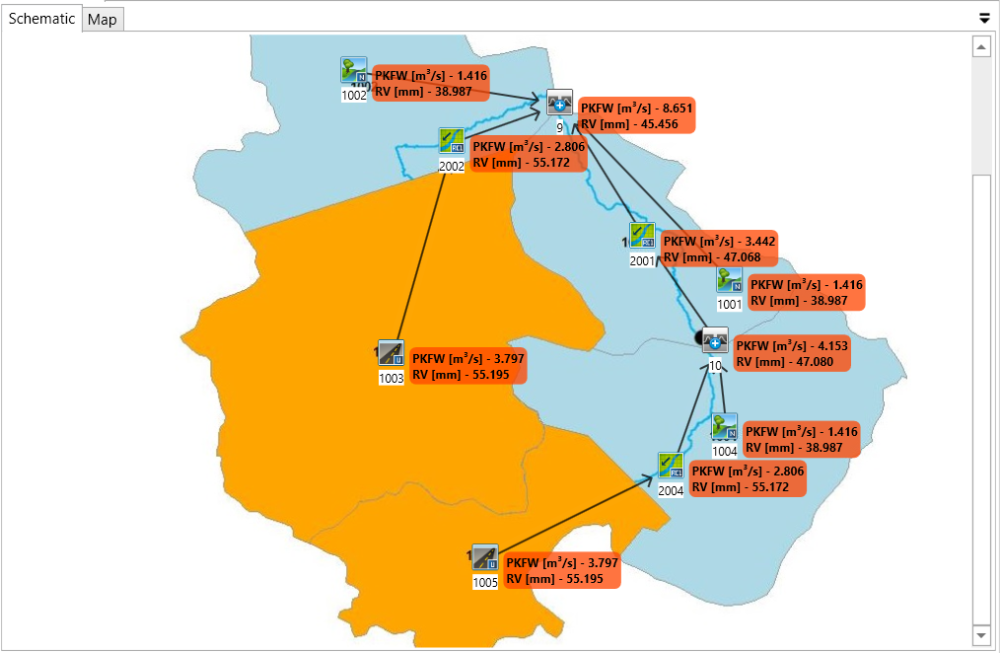
Notice that the numbers shown here are the same as the ones in the Hydrograph Result. - The summaries can also be labeled on the Canvas by using the Label Editor.
![]()
 gives the hydrograph graph. The hyetograph is shown on the top. Multi-graph can be shown here for comparison.
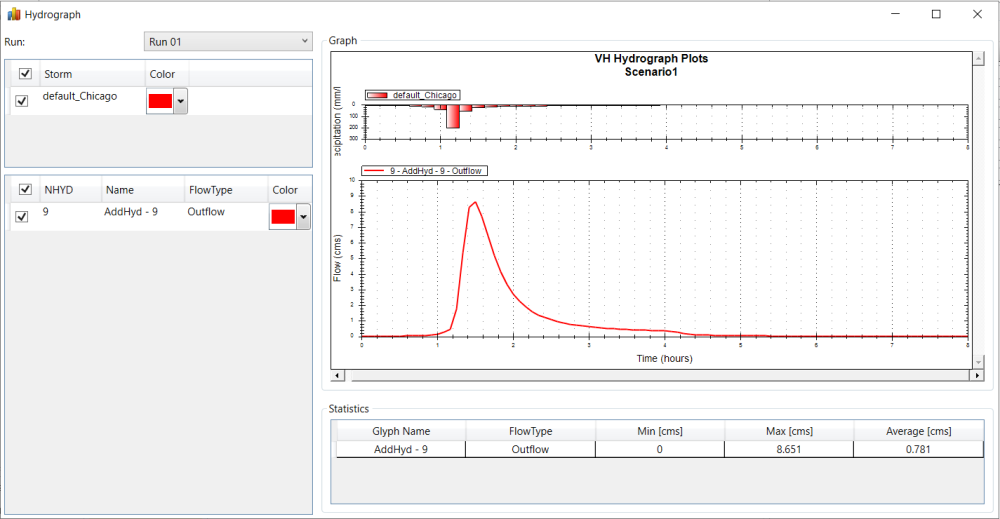
 gives the hydrograph table.
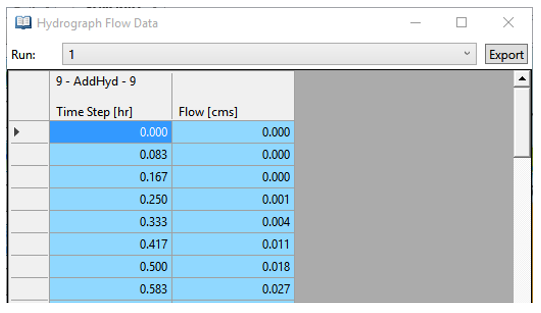
 gives a summary of the hydrograph in table format.
 gives the detailed text output.


Copyright © 2025 Smart City Water
—
Powered by 