
IDF data includes the rainfall intensity for various return periods. In Resource Library, the rainfall intensities of a certain return period are represented as an IDF Curve. A group of IDF Curves of different return periods is an IDF Group.
Each IDF Curve could be defined by three methods:
- IDF Curve Fitting Parameters A, B (i = A*t^B)
- IDF Curve Fitting Parameters A, B, C (i = A/(t+B)^C)
- Duration-Intensity Data Values.
In this exercise, we will use the duration-intensity data from EC.
To create a new IDF Group, first select the group where we want to add IDF group, i.e. “Test” -> “IDF” in this exercise, and then follow either of the following two ways: 1) click the IDF Group button in the toolbar; 2) right-click to open the context menu and choose the Add New IDF Group.

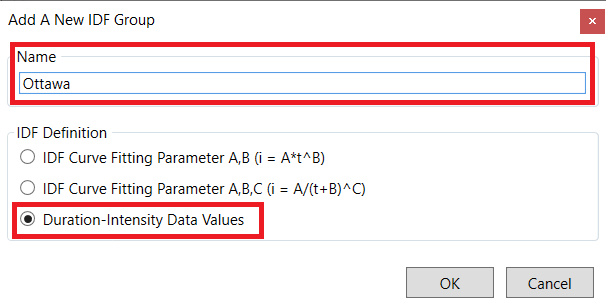
The Add A New IDF Group window will pop up. Enter the name as “Ottawa” and select the Duration-Intensity Data Values. Then click OK button.
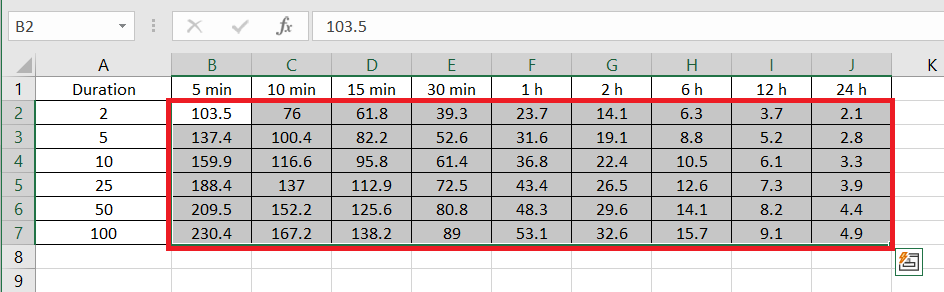
Navigate to the Library Explorer -> Test -> IDF to view the data and curves. The newly-created IDF Group is populated with default data. To use the duration-intensity data from EC, the table 2a/2b needs to be converted to the format as shown in IDF Tables, where the row is the return period and column is the rainfall intensity.

This conversion has been done and the converted data table is saved in Exercise #3\data\IDF\Ottawa IDF.xlsx. To apply this data table to the IDF Group, copy the highlighted data area. In Resource Library, select the cell for 2 year return period and 5 minute duration and choose Paste from context menu. The new data will be pasted to the table. Be careful to match the cell selection in the Excel file and in the IDF Table to make a correct paste. A wrong selection will lead to a wrong data paste.

The fitted ABC value of each IDF Curve could be checked out by selecting it in the Library Explorer.
