
It is necessary to compare the observed and simulated hydrograph in model calibration. Plotting the two hydrographs and the corresponding rainfall in the same plot is very helpful to guide the calibration.
Identifying the Gauge Objects’
To compare to an observed hydrograph, the location of the flow monitoring needs to be defined first. This is done by selecting the object and then right-clicking to open the context menu and choosing Has Gauge Here from the context menu.
Importing Observed Data
To import the observed data and setup the comparison, click the Plot Calibration button  . The Compared to Observed Data window will appear. In this window, on the left is where the observed data will be imported, and the comparison can be configured on the right.
To add observed data, click the Add … button at the left bottom corner and select the observed hydrograph data file. For file format, please refer to 10.3 Calibration Files. The observed data will be added to the Observed Data list. To remove it, select it in the list and click the Remove button at the bottom.
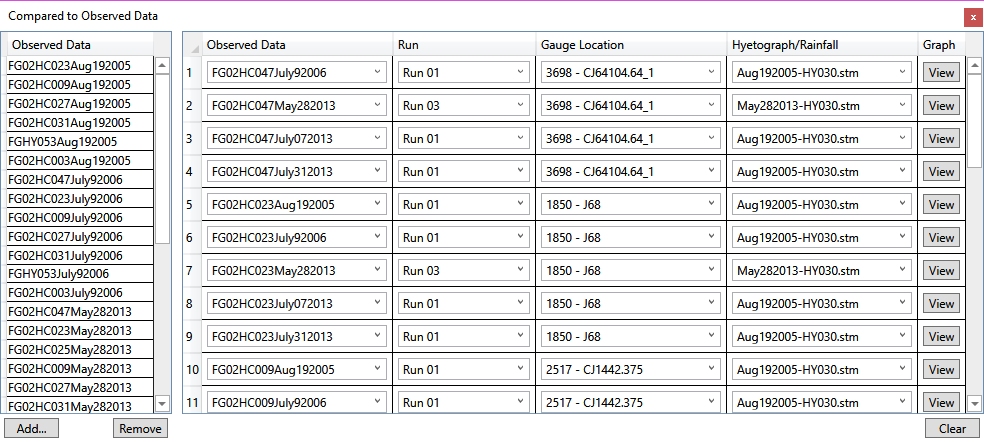
Adding Result Comparison
There are three components in a result comparison: 1) observed data, 2) simulated data and 3) corresponding rainfall. The observed data is added by drag-and-drop from the Observed Data list. The Simulated Data is specified by selecting the simulation Run and the corresponding Gauge Location. The hydrograph from the specified object will be used to compare with the observed data. The Corresponding Rainfall is the rainfall data that is responsible for the hydrograph response. It will be plotted on the top of the hydrographs as a reference. It is important to have this when analyzing the observed and simulated hydrograph. If the observed hydrograph is not a clear response from the rainfall, it may be necessary to check the rainfall data.
To create a result comparison, double-click an observed data in the Observed Data list or drag it to the Comparison list on the right. A new result comparison will be added in the Comparison list and the observed data is set to selected observed data. Once added, all the three components can be changed by selecting the desired items in the drop-down list. Note that Gauge Location only lists the objects that is set as a gauge using the Has Gauge Here context menu.
More than one comparison can be added using the same methods. This is useful for large watersheds with multiple flow monitoring stations.
Viewing Observed and Simulated Plot
After result comparisons are created, it is time to plot the observed and simulated hydrograph. To view the plot, click the View button on the far-right side of each result comparison. The Ob-served/Simulated Plot will appear.

The plot area is at the top where the rainfall is plotted above the observed and plotted hydro-graph. The observed hydrograph is in green and the simulated hydrograph is in red.
Below the plot area are the statistics of two hydrographs including the minimum flow (m³/s), maximum flow (m³/s), volume (m³) and relative difference of peak flow and volume. Often the latter should be in an acceptable range for a calibrated model. For example, TRCA usually requires the simulated volume should be +20% to -10% of the observed one and the simulated peak flow should be +25% to -15% of the observed peak flow. The given relative difference in this window would help determine if the simulated hydrograph is acceptable or not.
At the bottom is the control bar to navigate through multiple comparisons in cases where multiple flow monitoring locations are available. Click  or
or  to move to the previous or next comparison in the list. A summary information of current comparison is also shown between the two navigation buttons.