
For flood control purposes and master drainage planning, there are both rural and urban areas in the watershed. In Visual OTTHYMO, the rainfall losses in the rural areas are computed by means of the CN* procedure. The critical storms for rural conditions are long-duration storms such as the Southern Ontario Regional Storm with a peak intensity of 2.08 in/hr. The modified SCS method (CN*) is used in such conditions. The Horton model may result in underestimating the runoff mainly for low intensity storms, since it generates runoff only if the rainfall intensity is higher than the infiltration capacity rate. In such cases, the rainfall losses in the previous portion of the urbanized areas should also be computed with the CN* procedure. The ratio of the peak rainfall excess intensity to the peak rainfall intensity is an indicator of the effect of rainfall loss model. This ratio is called ![]() and the figure below shows
and the figure below shows ![]() against CN* and the maximum infiltration capacity rate for (Horton) for the Regional Storm.
against CN* and the maximum infiltration capacity rate for (Horton) for the Regional Storm. ![]() for this storm would be sensitive to the
for this storm would be sensitive to the ![]() (minimum infiltration capacity rate) selected.
(minimum infiltration capacity rate) selected.
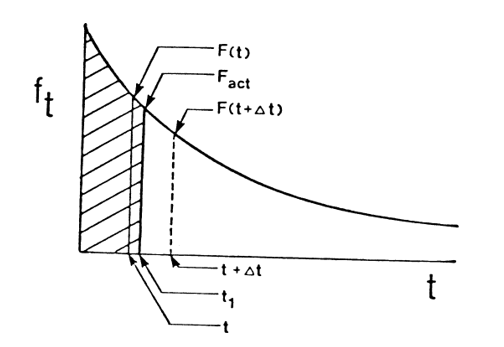
CUMULATIVE FORM OF HORTON’S INFILTRATION EQUATION
If the same storm is used in studying the effects of urbanization (e.g. comparing pre- and post-development flows), the CN* procedure can continue to be used for post- development conditions with STANDHYD.
For design purposes under urban conditions, however, the critical storms are the short- duration, high intensity storms such as the Chicago-type storms. Here Horton’s procedure is preferred because it is more sensitive to the storm intensity and in general results in higher peak flows than the CN* procedure. This is shown in the figure below for a residential watershed (30% imperviousness) for three storms, the 5-year, 100-year Chicago and the Regional storms.
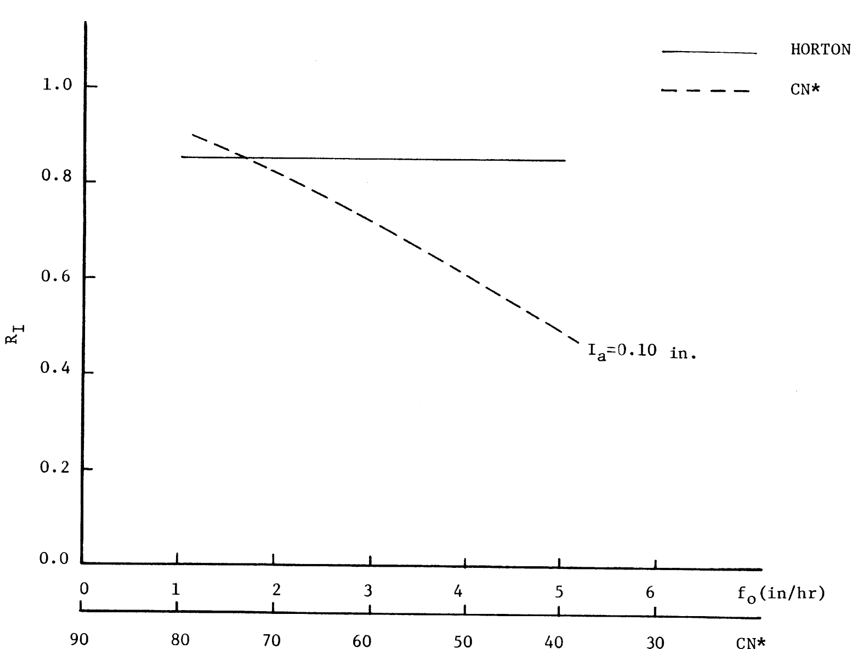
![]() VERSUS
VERSUS ![]() AND
AND ![]() : REGIONAL STORM (
: REGIONAL STORM ( ![]() =0.30 in/hr, α=2.0/hr)
=0.30 in/hr, α=2.0/hr)
A series of numerical experiments have been done to find a range of values in which the Horton and CN* procedures would give the same runoff volumes. The runoff volumetric coefficient Cv was calculated for different combinations of ![]() ,
, ![]() and values (Horton) and CN* values (with
and values (Horton) and CN* values (with ![]() = 0.10 in). The range of values tested were 1.0 to 5.0 in/hr for
= 0.10 in). The range of values tested were 1.0 to 5.0 in/hr for ![]() , 0.10 to 0.50 in/hr for
, 0.10 to 0.50 in/hr for ![]() and 2.0/hr and 4.14/hr for α (decay constant). The results are shown in the following two figures. It is observed that equivalent Cv does not mean that the corresponding peak flows are equivalent.
and 2.0/hr and 4.14/hr for α (decay constant). The results are shown in the following two figures. It is observed that equivalent Cv does not mean that the corresponding peak flows are equivalent.
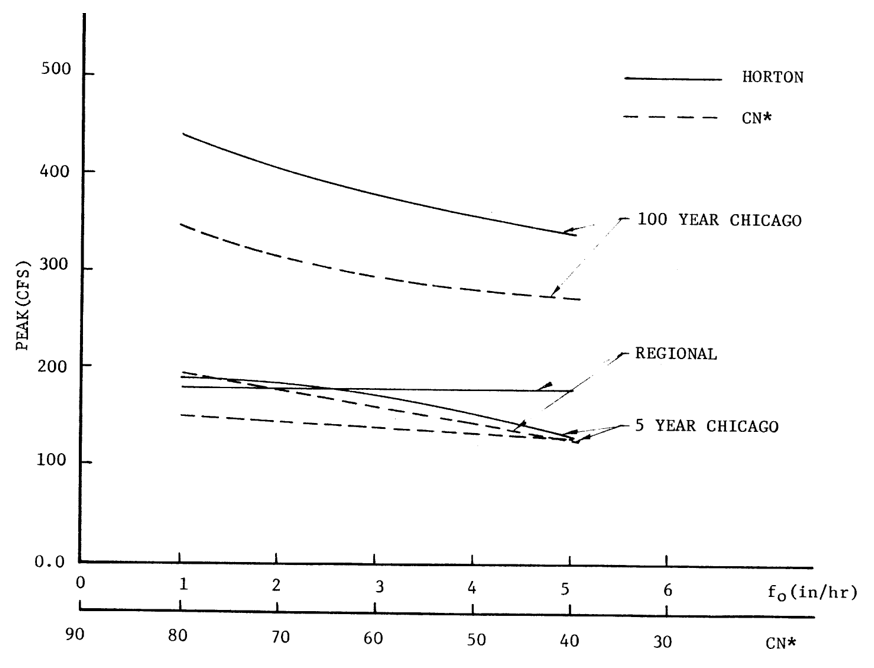
PEAK FLOWS FOR RESIDENTIAL WATERSHEDS (30% IMPERV.) ( ![]() =0.30 in/hr, α=2.0/hr)
=0.30 in/hr, α=2.0/hr)
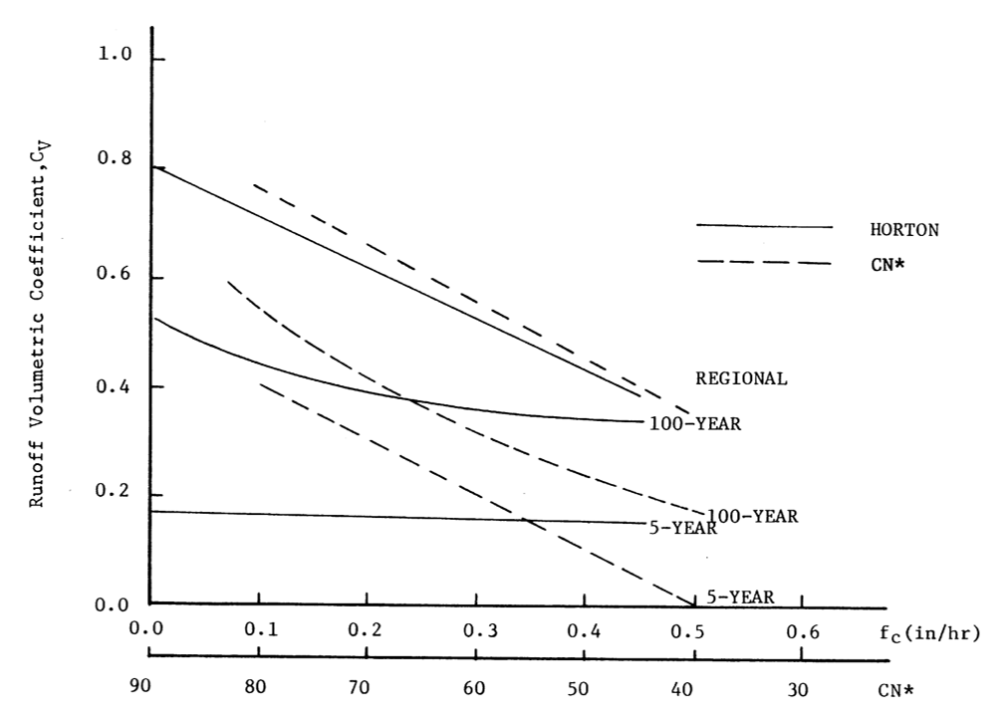
Cv VERSUS ![]() AND
AND ![]() WITH
WITH ![]() =3 in/hr, α=2,
=3 in/hr, α=2, ![]() =0.10 in
=0.10 in
It is also found that total runoff for the Regional storm is more sensitive to ![]() while for the Chicago storms they are more sensitive to
while for the Chicago storms they are more sensitive to ![]() . There is no range of values for which the Cv are matched for all three storms. The results show that the Cv for the Regional storm can be matched by varying
. There is no range of values for which the Cv are matched for all three storms. The results show that the Cv for the Regional storm can be matched by varying ![]() and that the Cv for the Chicago storms can be matched by varying
and that the Cv for the Chicago storms can be matched by varying ![]() .
.
These results also show that for consistency the selection of infiltration parameters should consider the characteristics of the soil and also those of the storm. Tables given in literature in which infiltration parameters like ![]() ,
, ![]() and CN are given in terms of soil groups A, B, C, D alone may not give consistent results.
and CN are given in terms of soil groups A, B, C, D alone may not give consistent results.
If data is available and the CN*-API relationship has already been derived during the planning stage, the CN* procedure can also be used for design purposes. The use of the CN* procedure with design storms is discussed in the section on design storms. This will result in compatibility between the planning and the design stages for the watershed.