
In the Project Manager, rename the Scenario1 as “Existing”. We will use this scenario to create a scenario for existing conditions. To rename the scenario, click on the scenario, then right click to open context menu and select Rename from the context menu.
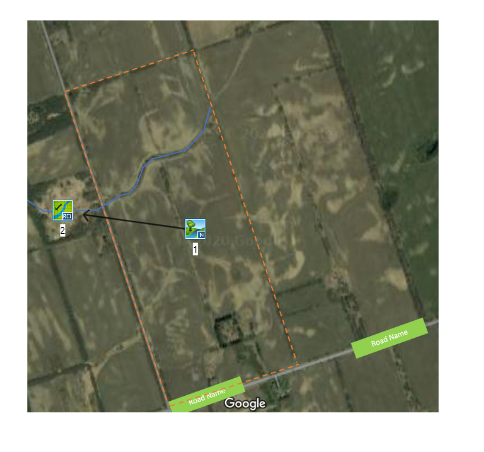
The existing condition is a natural site of 20 ha connected to the local stream. Therefore, we add a NasHyd command and a RouteChannel command to the Schematic view by dragging and dropping commands from the Tool Box and then add a link from the NasHyd to the RouteChannel. We also add the Background image “…/data/background/Existing.png”. Name the scenario as “Existing”. Your layout of the model on Schematic view will be looked like the figure below.
For more details about how to create model layout on the Schematic view, please refer to tutorial – creating a VO Model in Schematic View
Select the NasHyd command on the Schematic view and edit its parameters in the Properties tab as below.

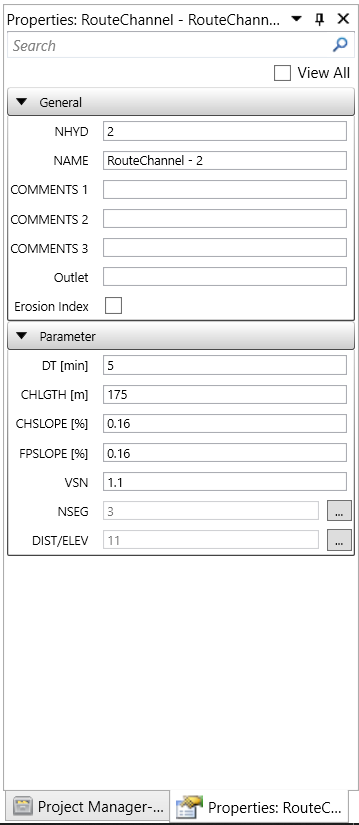
Select the RouteChannel command on the Schematic view and edit its parameters in the Properties tab as below.
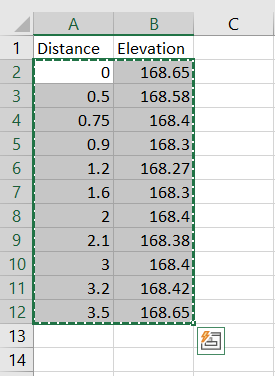
Click the button  next to the field DIST/ELEV in the Properties tab of RouteChannel to open the Cross Section Editor. Open the data file “…data\Cross Section and Rating Curve.xlsx” and the sheet “Cross Section”. Copy the distance-elevation table without header by pressing Ctrl+C. Then, go back to VO and click on the first cell under the DIST column in the Cross Section Coordinates table. Paste copied distance-elevation table by pressing Ctrl+V.
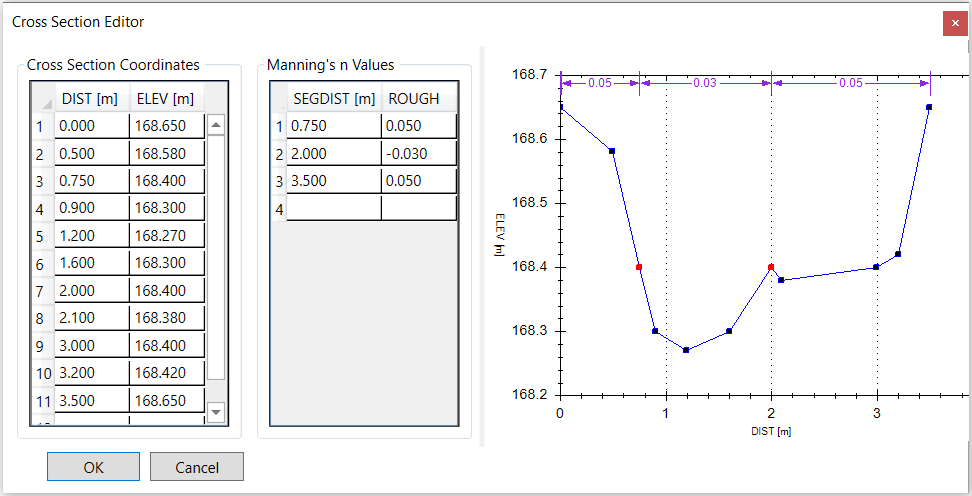
Following the same way, copy and paste the distance-roughness table to the Manning’s n Values table in the Cross Section Editor. Please note that the sign “-” in the number “-0.030” is just to identify the roughness used for bed section. This table is used to define roughness for bed and banks. More details are explained below.

After copying and pasting the cross section table and roughness table, the “Cross Section Editor” of the RouteChannel should be looked like the figure below. On the right-hand graph, the segment between the red dots are the bed and the segments outside the red dots are the banks. The roughness of bed and banks are shown on the top of the cross section curve. The left red dot on the graph corresponds to the first row in the Manning’s n Values table, which defines that the left band distance on the cross section is 0-0.075 m and roughness for the left bank is 0.050. The right dot on the graph corresponds to the second row in the Manning’s n Values table, where defines that the bed distance on the cross section is 0.075-2 m and roughness for the bed is 0.030. The last row in the Manning’s n Values table defines the right bank, whose distance on the cross section is 2-3.5 m and roughness is 0.050.
When creating a new single-event Otthymo project, the project is created with a default storm and run. We need to delete this default storm and run, because they will not be used for this tutorial. To do that, first, click Run button in the Simulation ribbon.

Then, in the pop-up Batch Run window. Select on the default run “Run 01” and press the Delete button  to delete the run. Close the Batch Run window.

Navigate to Project Manager and select on the “default_rain”. Right click to open the context menu and select Delete

In the pop-up message box, select Yes.
