
The rainfall inputs used with the event simulation models were a historical storm series and two design storms. The historical storm series was selected from the Bloor Street station rainfall record. A criteria was selected based on the storm volume and intensity so that approximately one storm event for each year in the record was chosen. This results in some years having more than one event and other years having no events. The selected events were then discretized to ten-minute time intervals. A summary of the storm events and their characteristics is given in Table 4.
TABLE 4 HISTORICAL STORM CHARACTERISTICS
| Date | Duration (hrs.) | Volume (mm.) | Time to Peak (hrs.) | Peak In-tensity (in./hr) | Average Intensity (in./hr) | API (mm) | |
| Sept. 15/57 | 6.67 | 47.84 | 4.167 | 59.18 | 7.19 | 19.8 | 37.5 |
| July 9/60 | 5.50 | 62.33 | 5.000 | 82.37 | 11.33 | 12.3 | 24.0 |
| June 19/61 | 6.17 | 37.12 | 2.867 | 49.28 | 6.02 | 24.5 | 45.0 |
| Sept. 13/62 | 2.00 | 42.62 | 0.167 | 159.26 | 30.28 | 13.2 | 25.0 |
| Nov.9-10/62 | 12.00 | 58.03 | 5.867 | 17.83 | 4.88 | 14.0 | 27.0 |
| Aug. 11/64 | 6.50 | 40.61 | 4.167 | 39.62 | 6.25 | 12.7 | 24.5 |
| Aug. 5/68 | 4.67 | 42.38 | 4.167 | 70.64 | 9.09 | 10.5 | 19.0 |
| Aug.22/68 | 9.00 | 72.90 | 3.167 | 58.62 | 8.10 | 31.6 | 53.5 |
| Aug.29-30/70 | 3.50 | 67.60 | 11.867 | 92.25 | 14.15 | 8.1 | 15.0 |
| May 16/74 | 12.00 | 58.32 | 8.500 | 56.34 | 4.85 | 49.4 | 74.0 |
| Aug. 23/74 | 0.67 | 51.20 | 0.333 | 153.62 | 76.81 | 5.5 | 8.0 |
| Aug. 23/75 | 9.17 | 57.22 | 2.667 | 77.72 | 6.25 | 7.7 | 14.0 |
| July 6/77 | 7.17 | 51.10 | 7.167 | 50.29 | 7.41 | 28.0 | 49.0 |
| July 31/77 | 0.87 | 45.19 | 0.333 | 156.77 | 54.23 | 16.2 | 31.0 |
| Sept. 24/77 | 10.67 | 60.96 | 8.333 | 26.24 | 5.99 | 24.8 | 45.1 |
The SCS 24-hour and Chicago design storms were compared with the historical storm series. The design storms were developed from the Bloor Street station IDF curves for return periods of 5, 10 and 25 years. The Chicago storm was 4 hours in duration and was discretized at 10-minute inter-vals. The SCS storm was 12 hours in duration and was discretized at 12 min. interval. The peak intensity and antecedent moisture conditions should be adjusted so that the design storm resembles real storm conditions.
The adjustment is necessary on urban catchments because the peak flows are dependent on the peak intensities. The scatter gram in the figure below shows that the correlation between peak flows and peak intensity is close to 1 in urban areas.
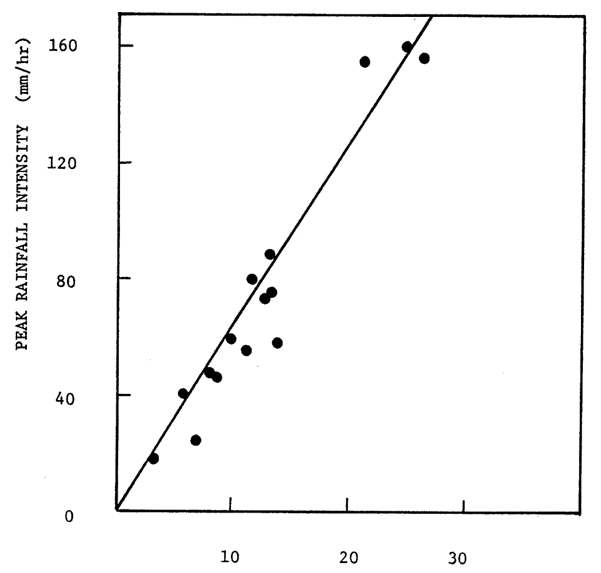
CORRELATION BETWEEN PEAK RAINFALL AND FLOWS (URBAN AREA 50% IMP)
The choice of the time step is important in obtaining a peak intensity close to the peak intensity of real storms. An analysis was conducted to demonstrate the importance of the time step used with a design storm. The 5- and 10-min. intensities were extracted for the highest recorded storms in Toronto (Hogg,1980). These were plotted along with the peak intensities of the Chicago design storm peak intensities discretized at 5- and 10-minute intervals as shown in the figure below. For the 5-minute intensities, the Chicago design storm intensities are higher than the real storm intensities, while for the 10-minute intensities they are slightly lower. Wisner and Gupta (1979) show that there can be a large variation in flows depending on the step size chosen for the design storm. Time steps between 10 and 20 minutes are recommended for use with the Chicago design storm. If the design storm peak intensity is still larger than that of real storms it should be adjusted so that the two peak intensities are similar.
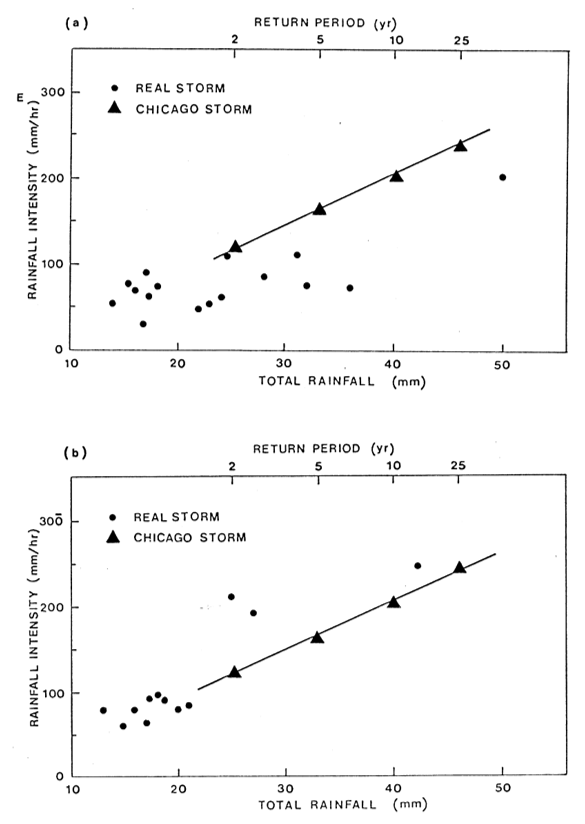
COMPARISON OF REAL STORM AND CHICAGO STORM INTENSITIES
The antecedent moisture conditions are usually not considered as being important when a design storm is used with an event simulation model. Some studies, though, have been conducted to investigate this. Wenzel and Voorhees (1979) tested design storms using both wet and dry antecedent moisture conditions, but they do not recommend a procedure for determining what conditions should be used with a design storm. The Flood Studies Report (NERC,1975) present a procedure for determining the antecedent moisture conditions. Using a relationship between the Ur-ban Catchment Wetness Index and the Standard Average Annual Rainfall the antecedent moisture conditions can be determined for the FSR design storm in any area in the U.K. In the present study the modified curve number is used to represent the antecedent moisture conditions. With the OTTHYMO model an average modified curve number, for a watershed, is used with the design storms.