
The U.S. Soil Conservation Service (SCS) has developed the ‘Type 1 and 2’ design storm. These have and are used both, in the U.S.A. and Canada. The SCS determined the mass curve for per-cent of accumulated rainfall depth over a duration of 24-hr. To obtain the mass curve, rainfall was analyzed across the U.S. SCS characterized the rainfall using the 4 types of storm patterns. The Type I and Type IA rainfall distribution is applicable to Hawaii, Alaska, the Coastal Sierra Nevada, the Cascade Mountains in California, Oregon, Washington, Alaska and Hawaii. The type III rainfall distribution applies to the Gulf of Mexico and Atlantic coastal area. The type II rainfall distribution applies to the remainder of the United States. The figure below illustrates the SCS 24-hour rainfall distribution. In Canada, the type II curve applies in most areas, however, there are some regions in British Columbia where the type I and IA curves are used and in east Canada where the type III curve is used.
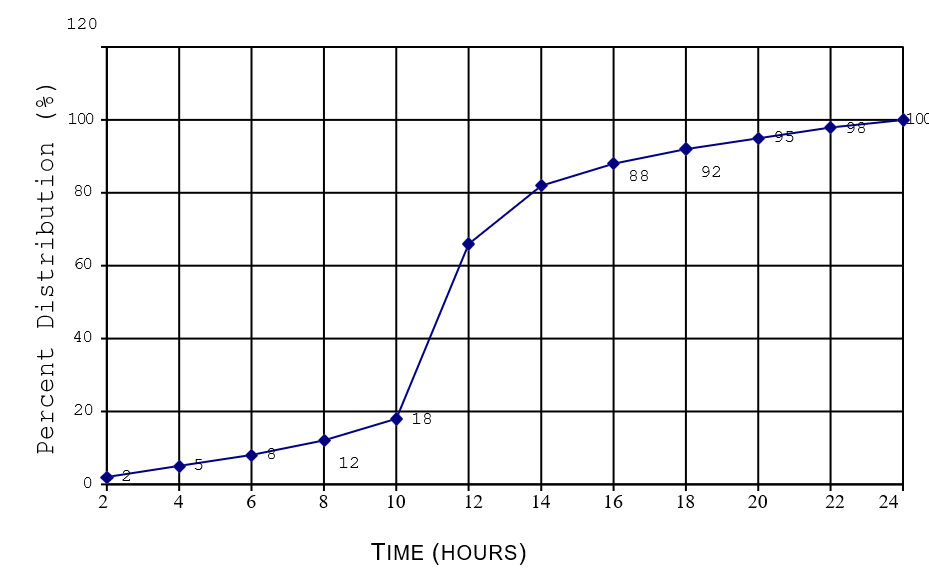
SCS II – 24 DESIGN STORM
To create a SCS design storm, a duration and return period is first selected. The corresponding volume is then distributed over the steepest portion of the SCS-24-hour curve. The incremental rainfall volumes and intensities are then obtained based on the volume distribution over the selected duration.
It’s worth noting that the Composite Design Storm can be rearranged to give a storm pattern very similar to the SCS design storm. This occurs because the SCS curves have been produced so that, for a selected 24-hour rainfall depth, the depth-duration curve derived from a SCS distribution would be very similar to the curve produced by the U.S. Weather Bureau.
Cronshey (1980) developed regional rainfall distributions to replace the SCS type II distribution in the 37 eastern and central states. The distributions consider variations due to the rainfall return period as well as regional differences. The ratio of rainfall volume in a fixed duration to the 24-hour rainfall volume was determined for many stations in the eastern United States. It was found that the rainfall ratios increase with distance from the coast and that the ratios are lower for a 100-year return period than for a 2-year period.
Four regions were identified with similar rainfall ratios and a special distribution was developed for each. Map are available within each area corresponding to fixed durations and return period. The maps are for 5, 15- and 60-minute durations and return periods of 2 and 100 years.