The continuous simulation models the water balance in snowpack and active soil zone. All the water balance components are available as time-series data from the outputs. Similar to hydro-graph summary, these water balance components are also summarized to help get the big picture.
Time Series
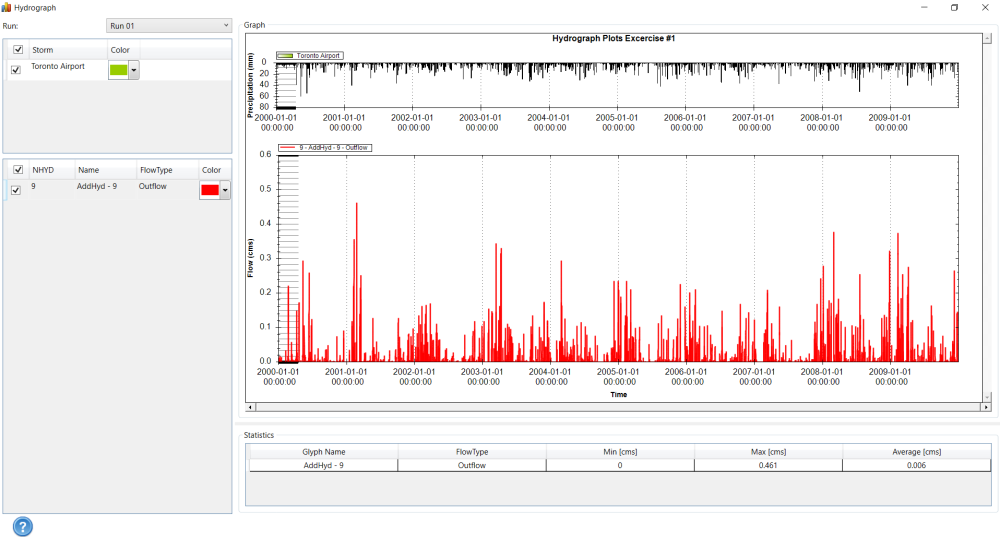
There are two ways to plot the time series data. The Hydrograph  button is similar to the one for single-event simulation, which will open the Hydrograph window plotting flow versus precipitation.
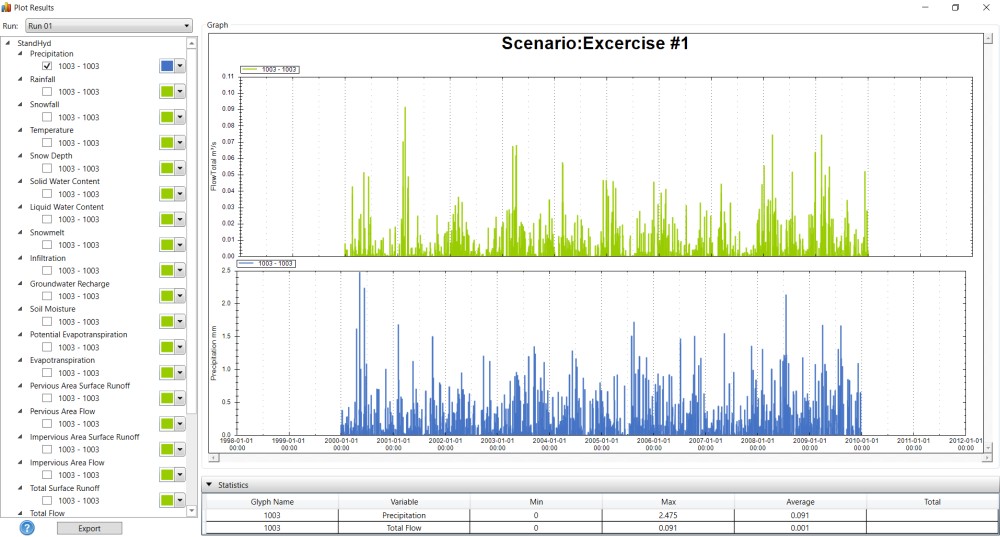
Another tool is Plot Results  , which will plot all available water balance components from a hydrological object. The time series data can be plotted with the original time interval or with higher values (year, month and week).
Summary
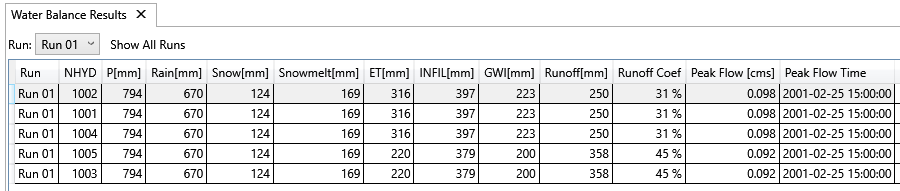
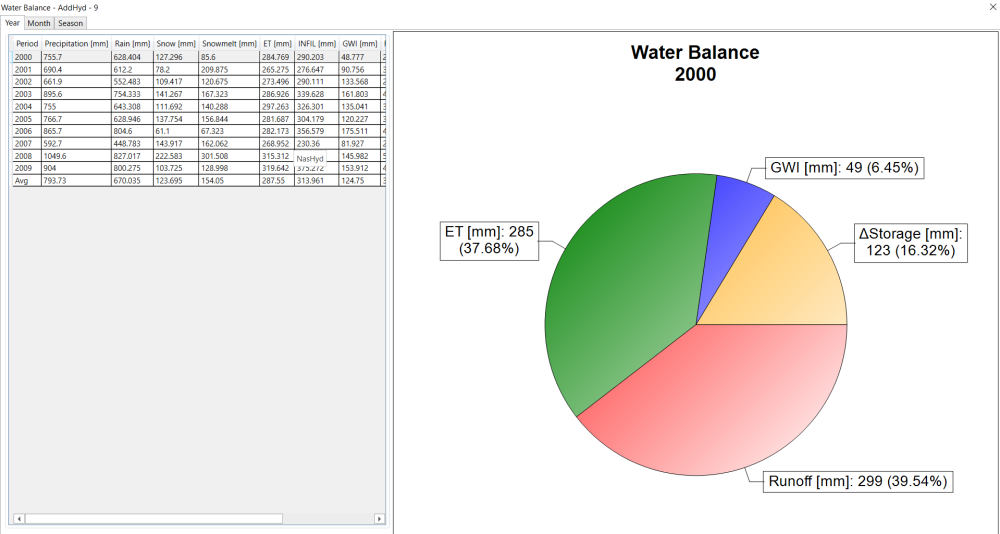
The average annual summary of the water balance components is shown in the Water Balance Results window located at the bottom.
To view the yearly and monthly summary for each catchment, choose Water Balance from the canvas context menu. The Water Balance window will appear.
The average annual summaries can also be labeled on canvas.