
The evaporation data is used estimate the evaporation from the depression storage and the evapotranspiration from the active soil zone. It could be time-series data of pan evaporation and calculated potential evapotranspiration (PET) or the monthly evaporation.
Monthly Evaporation
Monthly evaporation data is usually available from local agencies. The default monthly evaporation data is shown in Table 7.
Table 7 Monthly Evaporation Data
| Month | Evaporation (mm/month) | Month | Evaporation (mm/month) |
|---|---|---|---|
| Jan | 0 | July | 150 |
| Feb | 1.1 | Aug | 99.6 |
| Mar | 2.5 | Sep | 77.2 |
| Apr | 19.1 | Oct | 55.4 |
| May | 66.2 | Nov | 22.7 |
| Jun | 106.9 | Dec | 4.3 |
Calculated PET
Empirical equations are available to calculate PET based on other climate data, e.g. Penman-Monteith method, Priestley-Taylor method and Hargreaves method. The calculated PET time-series could be read into the model as the upper limit of evapotranspiration.
Pan Evaporation
When pan evaporation time series data is used, PET is calculated using a modified version of the U.S. Agricultural Research Service (ARS) equations (Warren Viessman, 1977). It accounts for the vegetation characteristics and amount of soil water available in the active soil zone. It’s given as:
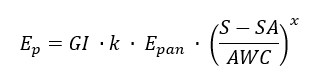
where:
![]() = potential evapotranspiration (mm),
= potential evapotranspiration (mm),
GI = the growth index of crop in % of maturity,
k = the ratio of GI to pan evaporation,
![]() = pan evaporation (mm),
= pan evaporation (mm),
S = total porosity,
SA = the available soil porosity (unfilled by water),
AWC = porosity drainable only by evapotranspiration,
x = the exponent and could be calculated as:
x = AWC / G
where G is the moisture freely drained by gravity.
Monthly growth index GI is used and the default growth index is given in Table 8.
TABLE 8 DEFAULT MONTHLY GROWTH INDEX
| Month | Growth Index | Month | Growth Index |
|---|---|---|---|
| Jan | 0 | July | 0.98 |
| Feb | 0.08 | Aug | 0.83 |
| Mar | 0.29 | Sep | 0.57 |
| Apr | 0.57 | Oct | 0.29 |
| May | 0.83 | Nov | 0.08 |
| Jun | 0.98 | Dec | 0 |
The ratio of GI to pan evaporation, k, is usually 1.0-1.2 for short grasses, 1.2-1.6 for crops up to shoulder height, and 1.6-2.0 for forest.
The pan evaporation ![]() is calculated with lake evaporation
is calculated with lake evaporation ![]() with
with
![]() =
= ![]() / ELKPAN
/ ELKPAN
where ELKPAN is the lake evaporation to pan evaporation ratio with value between 0.6 and 0.8 (Bruce Withers, 1974) and the lake evaporation could be using the monthly lake evaporation as shown in Error! Reference source not found. or the measured data.
S and G is the physical soil parameter. Representative values are given in Table 9.
TABLE 9 HYDROLOGIC CAPACITIES OF SOIL TEXTURE CLASSES (WARREN VIESSMAN, 1977)
| Texture Class | S (%) | G (%) | AWC (%) | x (AWC/G) |
| Coarse sand | 24.4 | 17.7 | 6.7 | 0.38 |
| Coarse sandy loam | 24.5 | 15.8 | 8.7 | 0.55 |
| Sand | 32.3 | 19.0 | 13.3 | 0.70 |
| Loamy sand | 37.0 | 26.9 | 10.1 | 0.38 |
| Loamy find sand | 32.3 | 27.2 | 5.4 | 0.20 |
| Sandy loam | 30.9 | 18.6 | 12.3 | 0.66 |
| Fine sandy loam | 36.6 | 23.5 | 13.1 | 0.56 |
| Very fine sandy loam | 32.7 | 21.0 | 11.7 | 0.56 |
| Loam | 30.0 | 14.4 | 15.6 | 1.08 |
| Silt loam | 31.3 | 11.4 | 19.9 | 1.74 |
| Sandy clay loam | 25.3 | 13.4 | 11.9 | 0.89 |
| Clay loam | 25.7 | 13.0 | 12.7 | 0.98 |
| Silty clay loam | 23.3 | 8.4 | 14.9 | 1.77 |
| Sandy clay | 19.4 | 11.6 | 7.8 | 0.67 |
| Silty clay | 21.4 | 9.1 | 12.3 | 1.34 |
| Clay | 18.8 | 7.3 | 11.5 | 1.58 |
S and G could be calculated using soil total porosity, field capacity and wilting point, where S equals to porosity minus wilting point and G equals to porosity minus field capacity as shown in the figure below Relation between Soil Moisture Limits and Soil Texture Class (Rossman & Huber, 2016). Their values are given for different soil textures in Table 9.
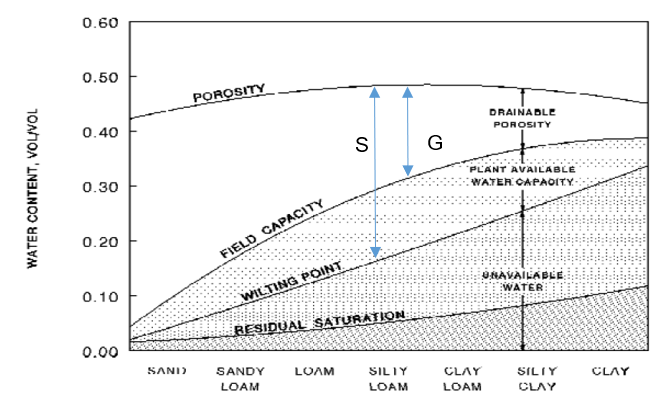
RELATION BETWEEN SOIL MOISTURE LIMITS AND SOIL TEXTURE CLASS (ROSSMAN & HUBER, 2016)