The main output from a single-event simulation is hydrograph. The hydrographs can be displayed in graph, table and summary.
Graph
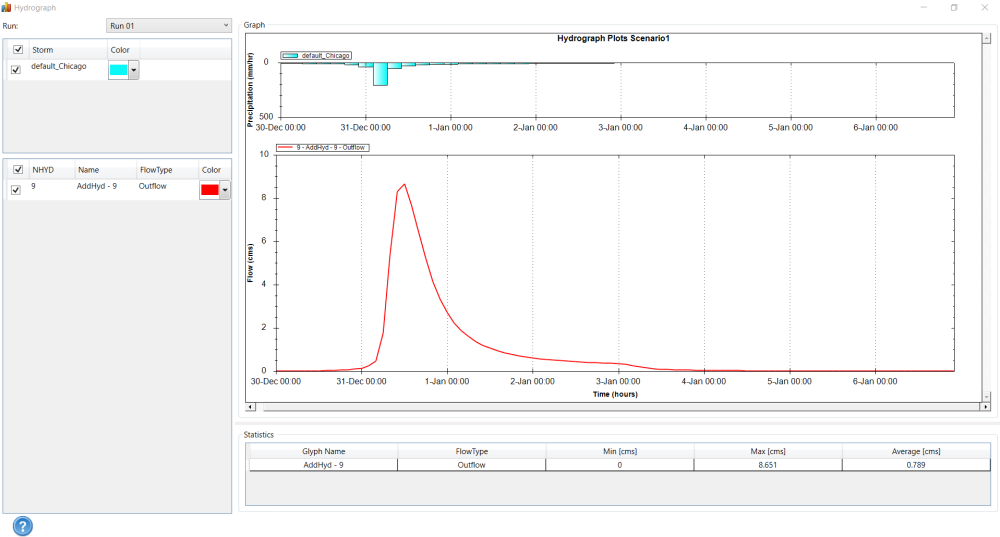
To plot hydrographs with rainfall, select the hydrologic objects and then click the Hydrograph button  in Simulation tab. The Hydrograph window will appear. The appearance of the plot can be changed using the control panel on the left.
Table
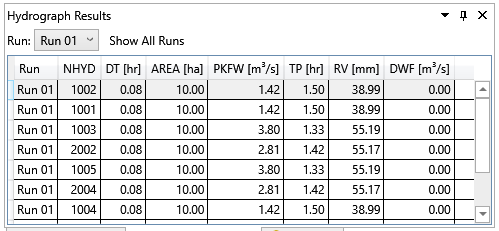
To view the hydrograph data in a table, click the Flow Data button  in Simulation tab. The data can be exported to a file.

Summary
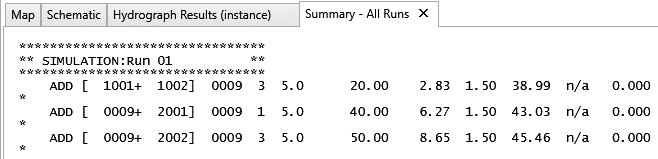
The summary of a hydrograph includes drainage area (AREA), peak flow (PKFW), time to peak (TP), runoff volume (RV) and dry weather flow (DWF). To view the summary of all hydrographs, use the Hydrograph Result window located at the bottom.
The summaries can be labeled on canvas beside the hydrologic objects as shown in the figure below. Refer to section 7.7 to apply labels onto the canvas.

Text
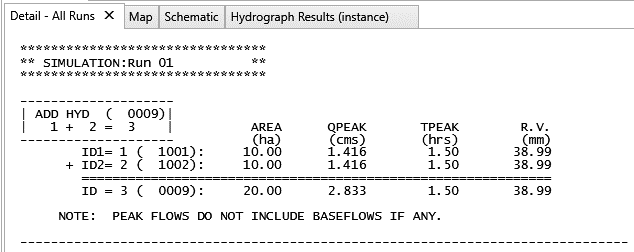
The classic OTTHYMO detail and summary output is available through the Detail Output  and Summary Output
  button.