
We will investigate how LIDs can improve on runoff controls by comparing water balance distributions before and after the LIDs.
Click on the scenario tab “Post-Dev. Solved” on the Schematic view to show the post-development scenario with LIDs.
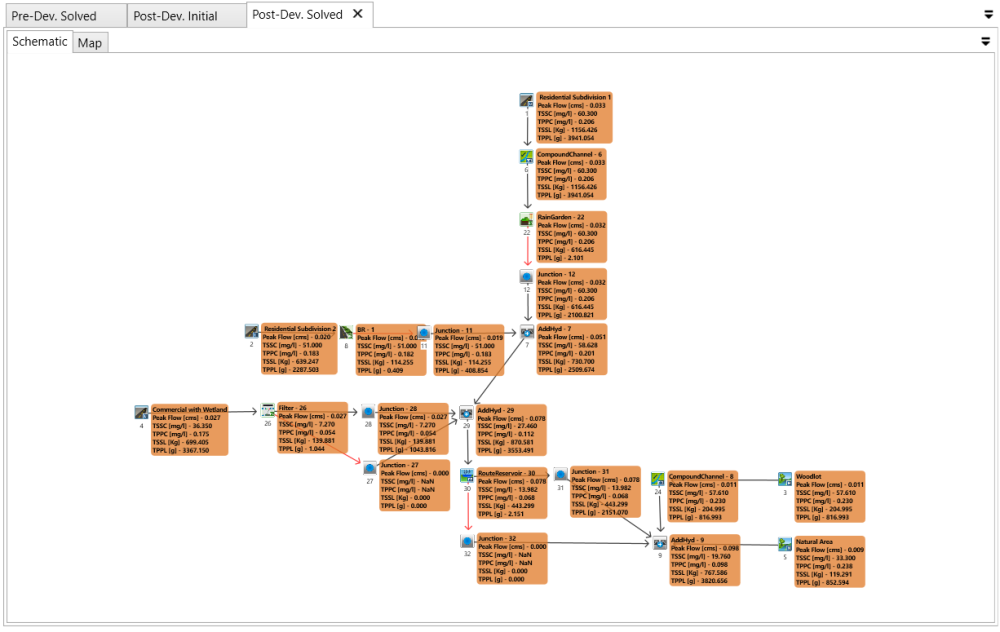
Zoom into the area of “Residential Subdivision 2” and “BR – 1” by scrolling the mouse wheel.
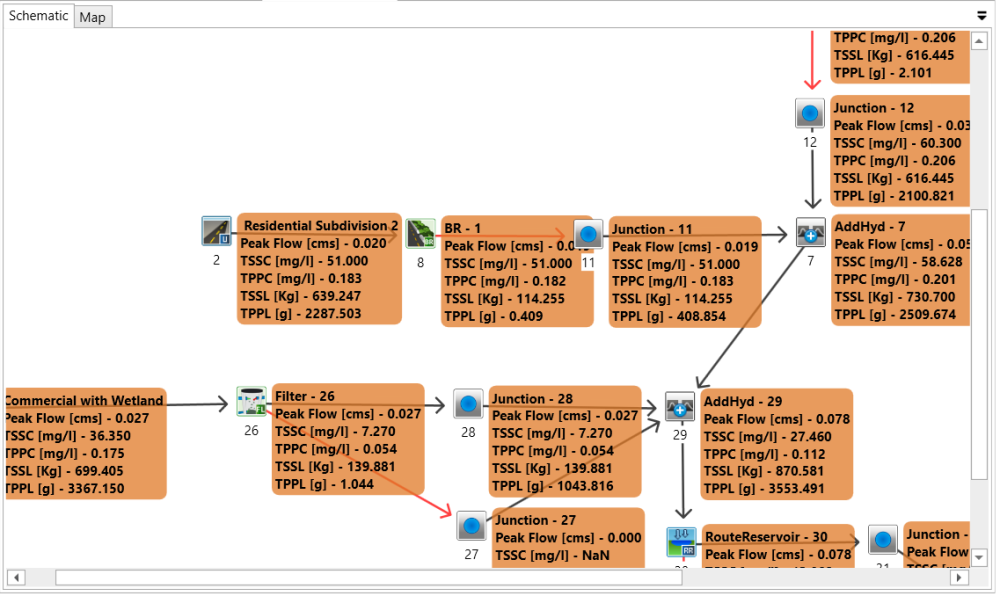
Water balance before the Bioretention tank
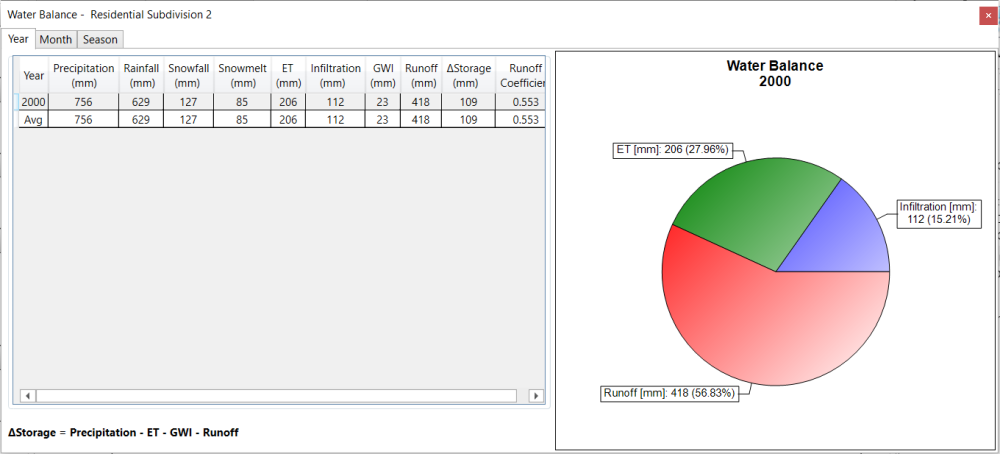
Click on the StandHyd command “Residential Subdivision 2” and then click the Water Balance button ![]() in the Simulation toolbar. This will open the Water Balance window for the “Residential Subdivision 2”. It displays pie-charts on the right about the absolute values and percentages of water volume distributed in three sectors: Runoff (red), Infiltration (blue) and ET (evapotranspiration, green). It also summarize the water balance and other information in a table on the left. Write down the number of Runoff volume (i.e. 418 mm) and we will use it for the calculation later.
in the Simulation toolbar. This will open the Water Balance window for the “Residential Subdivision 2”. It displays pie-charts on the right about the absolute values and percentages of water volume distributed in three sectors: Runoff (red), Infiltration (blue) and ET (evapotranspiration, green). It also summarize the water balance and other information in a table on the left. Write down the number of Runoff volume (i.e. 418 mm) and we will use it for the calculation later.
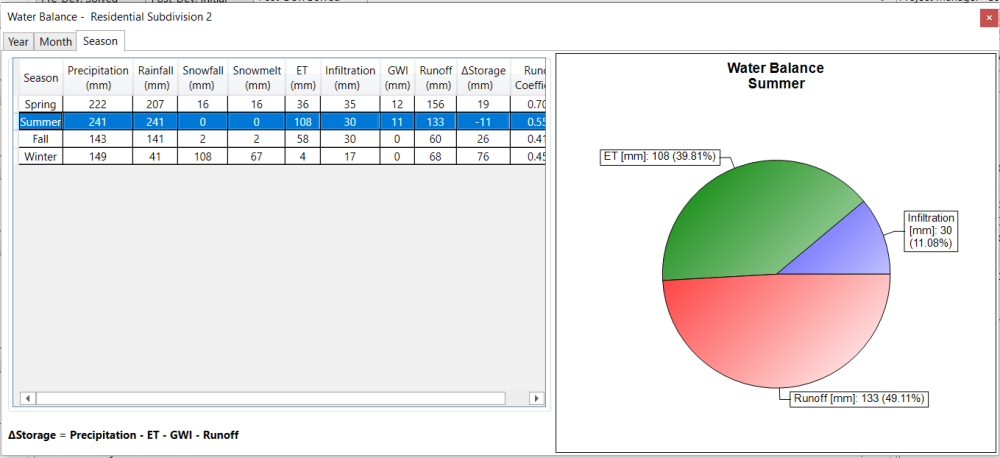
Click on the tab of Year, Month and Season on the table to view the results annually, monthly and seasonally. For example, click Season tab. The following window will display. By default, it will show the table and pie-chart for the Spring.
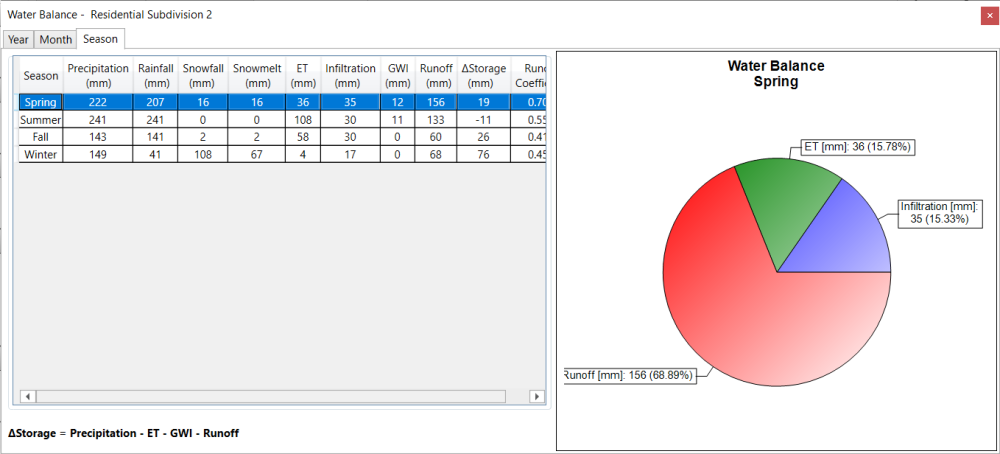
Click on the row in the Season table. The pie chart on the right will update with the water balance for that season. For example, click the row of Summer. The window will display like the figure below. It is clear that the Water Balance distribution changes with Season, which is related to the seasonal variation of rainfall and temperature.
Water balance after the Bioretention tank
Click on the Junction command “Junction – 11” and then click the Water Balance button ![]() in the Simulation toolbar. This will open the Water Balance window for the “Junction – 11” which is located after the Bioretention.
in the Simulation toolbar. This will open the Water Balance window for the “Junction – 11” which is located after the Bioretention.
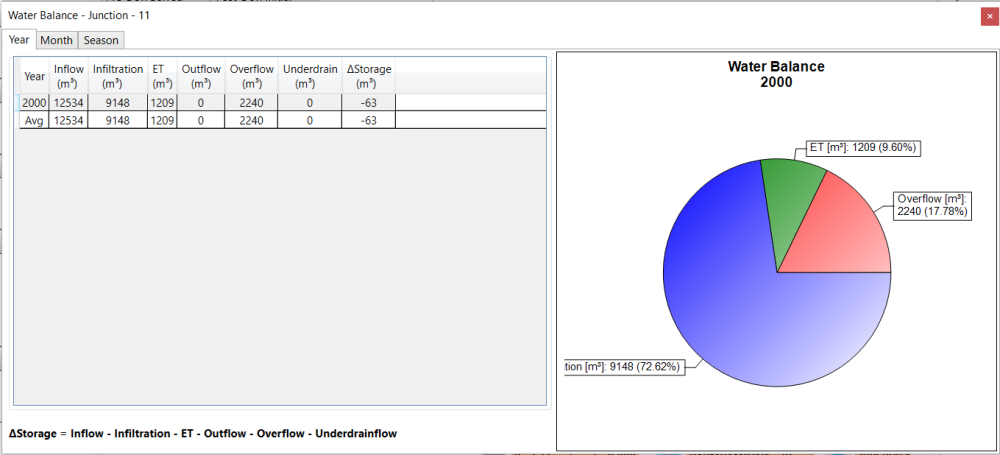
From the pie-chart, we can see that by using the Bioretention LID, most of water volume goes to the Infiltration, which will significantly reduce the runoff.
Please note that the water volume is counted in the unit of ![]() for the Junction command, but in the unit of mm for the Hydrograph command. Therefore, we should convert the unit for comparing the absolute values of water volumes.
for the Junction command, but in the unit of mm for the Hydrograph command. Therefore, we should convert the unit for comparing the absolute values of water volumes.
Click on the StandHyd command “Residential Subdivision 2”. Navigate to the Properties tab and look for the field AREA. The area of StandHyd “Residential Subdivision 2” is 3 ha (i.e. 30000 ![]() ). Therefore, the runoff volume from the StandHyd “Residential Subdivision 2” can be calculated from the unit of mm to the unit of
). Therefore, the runoff volume from the StandHyd “Residential Subdivision 2” can be calculated from the unit of mm to the unit of ![]() : 30000 * 418/1000 = 12540
: 30000 * 418/1000 = 12540 ![]() , where 418 is the Runoff volume in the unit of mm that was written down before from the Water Balance pie-chart of the StandHyd command “Residential Subdivision 2”.
, where 418 is the Runoff volume in the unit of mm that was written down before from the Water Balance pie-chart of the StandHyd command “Residential Subdivision 2”.
By looking at the pie-chart of Junction “Junction – 11”, the Overflow is only 2240 ![]() . Therefore, compared to the total Runoff from the StandHyd “Residential Subdivision 2”, which is 12540
. Therefore, compared to the total Runoff from the StandHyd “Residential Subdivision 2”, which is 12540 ![]() , a lot of water volume goes to Infiltration (i.e. 9148
, a lot of water volume goes to Infiltration (i.e. 9148 ![]() ) and some goes to ET (i.e. 1209
) and some goes to ET (i.e. 1209 ![]() ) .
) .