
Flow simulation for urban drainage studies is mostly done with one-event simulation models. The single event models determine flows produced by a single storm event. Continuous simulation models require rainfall data over a continuous period for the desired length of analysis. A frequency analysis is then conducted on the peak flows so that a flow of a desired return period may be found.
The flow with a single event model may be found by using a series of selected historical events or by using a ‘design storm’. The historical storm series may be selected using a continuous simulation program or by analyzing a rainfall record using a selection criteria. Each event in the selected series is then run through the event simulation model. The generated peak flows are then analyzed to determine their return period.
Design storms or model storms are single event rainfalls that are assumed to produce flows of a desired return period. They are of two types; synthetic design storms and historic design storms. Synthetic design storms are storms developed from intensity- duration-frequency (IDF) curves. Historic design storms are large single storm events; usually containing the maximum precipita-tion on record. In southern Ontario, hurricane Hazel is used as an historic design storm. In this text only, synthetic design storms are examined.
Each design storm has a unique temporal variation of intensity. Two general methods are used to determine the hyetograph shape. The first method derives the storm pattern based on an IDF curve. The design storms using only an IDF curve are the Uniform design storm, the Composite design storm and the Chicago design storm. The second method obtains the temporal structure of the design storm from an analysis of historic storm events. These are the U.S. Soil Conservation Service (SCS) 24-hour design storm, the SCS 6-hour design storm, the Illinois State Water Sur-vey (ISWS) design storm, the Atmospheric Environment Service (AES) design storm, the Flood Studies Report (FSR) design storm, the Pilgrim and Cordery design storm and the Yen and Chow design storm. Design storms that are not discussed are the Sifalda design storm, the Hamburg design storm and the Desordes (French) design storm. A more detailed description of each design storm is contained in the Design Storm Profiles section of this document. Table 2 summarizes the main characteristics of these design storms.
TABLE 2 SUMMARY OF DESIGN STORM CHARACTERISTICS
| *Design Storms | *Design Return Period | *Storm Duration | *Total Rainfall Depth | *Temporal Distribution | *Antecedent Moisture Conditions | *Intended Application |
|---|---|---|---|---|---|---|
| Uniform | User spec. | |
i x |
No variation in intensity | No | Sewer sizing |
| Composite | User spec. | |
i x |
User selected | No | Sewer sizing |
| Chicago | User spec. | Usually be-tween 2-6 hrs. T | i x T | Based on an IDF curve | No | Sewer sizing |
| SCS 24-hr. | User spec. | Long duration usually 12-24 hrs. T | i x T | Tabulated type 1 & 2 distributions | Yes | Rural watersheds |
| SCS 6-hr. | User spec. | 6 hrs. | Given in maps | Tabulated | Yes | Design of small dams |
| ISWS | User spec. | 1 hr. | I x 1 | Huff 1st quartile 50% distribution | No | Sewer sizing |
| AES | User spec. | 1 or 12 hrs. T | i x T | Regional charts for the 1 and 12 hr. durations | No | Not specified |
| FSR | User spec. | 12, 30, 60,120 min. |
i x td | 50% summer profile | Yes | Non-urban studies |
| Pilgrim & Cordery | User spec. | User spec. T | i x T | Local analysis of storm events | Yes | Urban and rural areas |
| Yen & Chow | User spec. | |
i x |
Triangular | No | Drainage facilities in small areas |
![]() – time of concentration
– time of concentration
T – user selected storm duration
![]() – storm duration selected using an iterative procedure. The design storm is tested using different durations. The one with the largest peak flow is selected.
– storm duration selected using an iterative procedure. The design storm is tested using different durations. The one with the largest peak flow is selected.
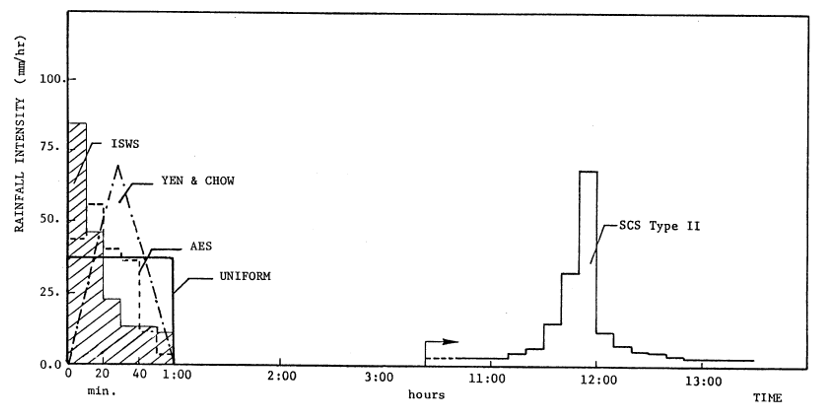
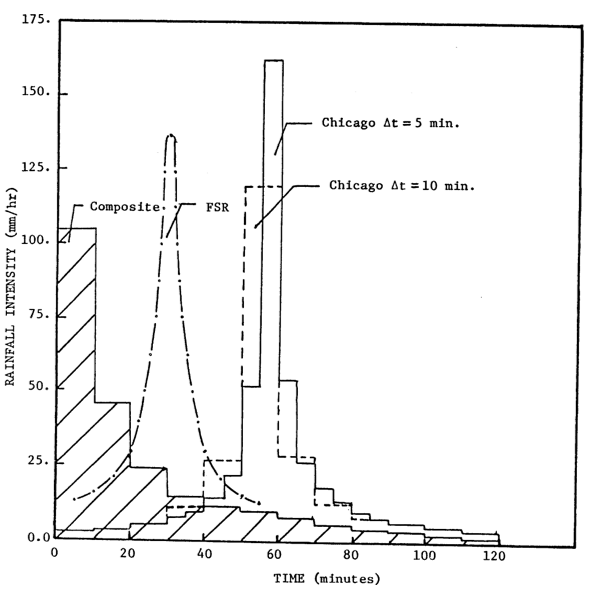
Each of the design storms has a different hyetograph shape. Storm hyetographs were constructed and compared for some of the design storms. A five-year return period was selected and the storm volumes were obtained from the Bloor Street station (Toronto) IDF curve. The duration of the storms are not all the same, for this reason the storm volumes are different. The storm hyetographs for the Uniform, Composite, Chicago, SCS 24-hr., ISWS, AES, FSR, and Yen and Chow design storms are shown in the figures below.
COMPARISON OF DESIGN STORMS
COMPARISON OF DESIGN STORMS
All of the design storms are different. The peak intensities, storm profiles, durations and volumes vary even though they all have the same return period. The Uniform design storm has the lowest intensity. It has a constant intensity and is not recommended for use with an event simulation model. The Chicago design storm has a high peak intensity. The peak intensity of this storm de-pends on the time step one selects. In Figure 25 the time step was increased from 5 to 10 minutes this reduced the peak intensity by 29% from 168 mm/hr to 120 mm/hr. The FSR and Composite design storms also have high peak intensities, but their shapes are not similar. The ISWS, SCS 24-hr., AES and Yen and Chow design storms have peak intensities that are in the same range. The peak rainfall for the SCS 24-hour and the Yen and Chow storms that were computed are the same.
The wide variety of hyetograph profiles is why design storms of the same return period will not produce the same peak flows. Studies are therefore required to determine if design storms can be used to predict flows of a desired return period.
A review of previous studies showed that there is contradictory opinion regarding the use of design storms. Marsalek (1978) does not recommend the use of design storms while the results of Arnell (1982) and Watson (1981) suggest that design storms should be used. Other researchers have concluded that further studies are required.
Those who recommend the use of design storms consider that their advantages outweigh the shortcomings. The advantages of using design storms are that:
- They are an inexpensive procedure for obtaining flows of a desired return period.
- If properly selected they give conservative results for peak flows and volumes.
- They are widely used in current engineering practice.
Some of the disadvantages of design storms are that:
- The runoff frequency is assumed to be the same as the rainfall frequency. This equivalence of return period has not been shown to be true.
- The rainfall volume is not the rainfall volume of real storm events.
- Using IDF relationships to obtain a design storm hyetograph may be incorrect.
A study was conducted using IMPSWM procedures to test two design storms commonly used by Canadian engineers. The uniform design storm was not tested because of its low, unrealistic in-tensity. The Chicago and the SCS 24-hr design storms were selected for the study. The AES de-sign storm could have been used but the 30% profile with a 1-hour duration gives peak flow results close the Chicago storm and historical storm flows (Wisner and Gupta, 1980). With a 12-hour duration the AES 50% profile gives results similar to the SCS 24-hr. design storm. The third chapter contains the results that compare the Chicago and the SCS 24-hr design storms. The methodology can be used for any other design storm by a municipality.