
The SCS CN procedure is based on the equation
 (6)
(6)
It is assumed in the procedure that the initial abstraction ![]() = 0.2 S. This results in the equation
= 0.2 S. This results in the equation
 (7)
(7)
The curve numbers CN are functionally related to S by
 (8)
(8)
CN can be obtained from tables based on land use, soil type and soil moisture conditions. However, the soil moisture is determined only for three antecedent moisture conditions (AMC), classified on the basis of precipitation in the previous 5 days. CN has no intrinsic meaning but is only a non-linear transformation of S, which is a storage parameter. CN varies from 0 (Q=0 for all P) to 100 (Q=P for all P). In Eqn. 8, the 10 and 1000 have inch dimensions. Conversion can be made to the metric system.
Background information on the derivation of the procedure can be found in a paper by Rallison and Cronshey (1979). In the mid-50s when the SCS CN procedure was developed, the only data available were daily precipitation and runoff records from agricultural watersheds and infiltration curves from infiltration studies. Rainfall versus Runoff (P vs Q) data were plotted. A grid of plotted CN for ![]() = 0.2S was then overlaid and the median CN selected. The values in the SCS NEH-4 manual (1971) represent the averages of median site values for hydrologic soil groups, land cover and hydrologic conditions. The SCS work involved considerable interpolation and extrapolation for different soil types and land cover. The rainfall versus runoff plots were also used to define enveloping CN for each site.
= 0.2S was then overlaid and the median CN selected. The values in the SCS NEH-4 manual (1971) represent the averages of median site values for hydrologic soil groups, land cover and hydrologic conditions. The SCS work involved considerable interpolation and extrapolation for different soil types and land cover. The rainfall versus runoff plots were also used to define enveloping CN for each site.
The SCS CN procedure is in widespread use and there has been criticism of the procedure (Hawkins 1978, Altman et al. 1980, Golding 1979) because it is often applied beyond the original conditions and intended use.
Some of the concerns about the procedure are over:
- why the antecedent moisture range of values is a discrete rather than a continuous relationship,
- the lack of a clear definition of AMC II, the standard reference moisture condition,
- use of a 5-day time interval as a basis for classifying antecedent moisture conditions,
- why is
![]() = 0.2S,
= 0.2S, - what probability levels are associated with the envelopes in defining AMC I and AMC III.
The SCS CN procedure may severely underestimate the runoff volume, especially for small rainfalls. It was found that the runoff volumes obtained from real measurements on two residential watersheds were greater than those computed using CN = 90 (corresponding to a high degree of imperviousness).
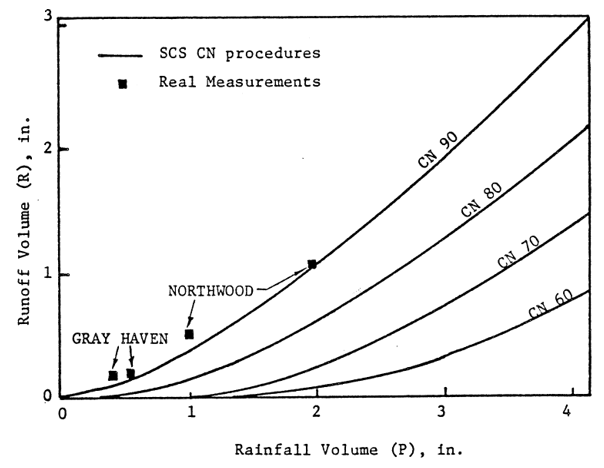
RELATIONSHIP BETWEEN RAINFALL AND RUNOFF: CN AND REAL MEASUREMENTS (WISNER, GUPTA, KASSEM, 1980)
A study in Texas (Altman et al. 1980) involving four watersheds found that the optimized CN were greater than the weighted CN for four of the six watershed conditions studied (Table 1).
TABLE 1 COMPARISON OF CALCULATED AND OPTIMIZED CN (ALTMAN, ESPEY, FELMAN, 1980)
| Watershed | Date (calc.) | CN (calc.) | CN (opt.) |
|---|---|---|---|
| Austin, Texas Region | |||
| Waller Creek (urban) | 1957-1959 1962-1965 1971-1973 |
84 84 84 |
92 79 81 |
| Wilbarger Creek | 1964-1975 | 83 | 85 |
| Dallas, Texas Region | |||
| Turtle Creek (urban) | 1967-1976 | 86 | 93 |
| Spanky Branch | 1973-1975 | 84 | 96 |
For areas with low CN, the SCS procedure may give significant errors. Golding (1979) utilized the SCS CN procedure to simulate runoff from a gauged urban basin in South Florida (58.3 ac., Group A soil, 36% imperviousness, 18% directly connected imperviousness). He found that the computed ![]() amounted to 0.86 inches (CN=70), which was greater than the total recorded rainfall on the basin, which had peak flows of up to 40 cfs in many cases. Reduction of the initial abstraction may give a more realistic runoff volume. The figure below compares the runoff volumes obtained for different
amounted to 0.86 inches (CN=70), which was greater than the total recorded rainfall on the basin, which had peak flows of up to 40 cfs in many cases. Reduction of the initial abstraction may give a more realistic runoff volume. The figure below compares the runoff volumes obtained for different ![]() and
and ![]() = 0.2S for storms of 3 return periods (Rowney, 1982). The SCS CN procedure is still a popular and simple tool, which will be around for some time to come. It is felt that with some improvements in the procedure and proper application, the method is still useful.
= 0.2S for storms of 3 return periods (Rowney, 1982). The SCS CN procedure is still a popular and simple tool, which will be around for some time to come. It is felt that with some improvements in the procedure and proper application, the method is still useful.
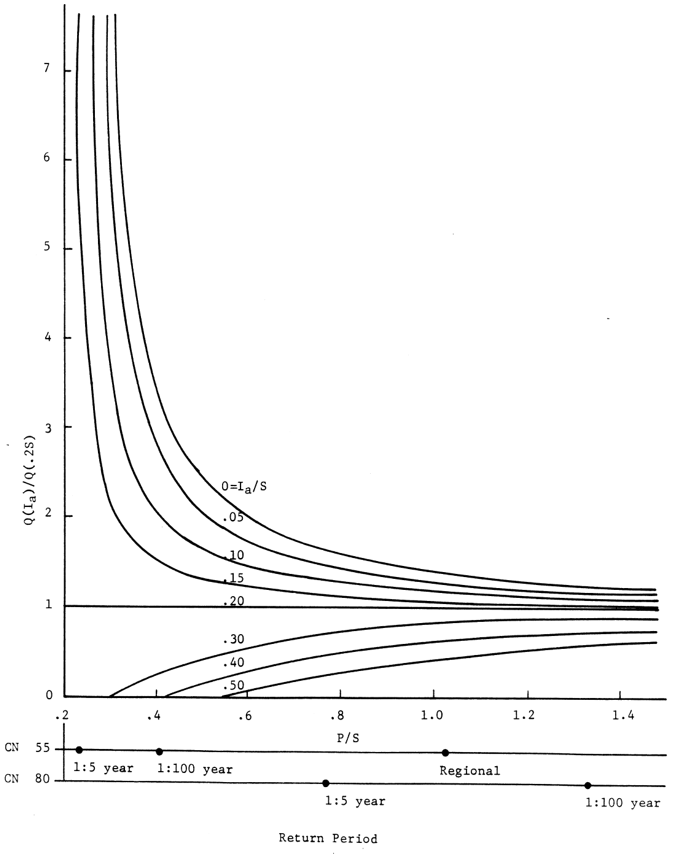
RELATION BETWEEN RUNOFF VOLUME: Q(![]() ) (USING INITIAL ABS. =
) (USING INITIAL ABS. = ![]() ), Q(0.2S) (USING INITIAL ABS. = 0.2S), (ROWNEY, 1982)
), Q(0.2S) (USING INITIAL ABS. = 0.2S), (ROWNEY, 1982)
The methodology used in OTTHYMO involves determining the initial abstraction ![]() from the runoff threshold curve obtained from rainfall and runoff records (Jobin, 1982). A program called SECSER has been written in order to do this. The runoff volumes for the storms are then used to calibrate the CN with this
from the runoff threshold curve obtained from rainfall and runoff records (Jobin, 1982). A program called SECSER has been written in order to do this. The runoff volumes for the storms are then used to calibrate the CN with this ![]() . The resulting CN are called CN*. Instead of using 3 discrete AMC classes, the antecedent moisture condition is classified by the API (antecedent precipitation index) which is calculated from the hourly rainfall records. The API for each storm is then plotted against the CN*. The CN* for other storms can then be determined from this CN*-API relationship once the API for these storms are determined. This relationship would be a continuous one as compared to the 3 discrete classes used in SCS. It also would not require the definition of a standard reference moisture condition.
. The resulting CN are called CN*. Instead of using 3 discrete AMC classes, the antecedent moisture condition is classified by the API (antecedent precipitation index) which is calculated from the hourly rainfall records. The API for each storm is then plotted against the CN*. The CN* for other storms can then be determined from this CN*-API relationship once the API for these storms are determined. This relationship would be a continuous one as compared to the 3 discrete classes used in SCS. It also would not require the definition of a standard reference moisture condition.
A small program has been written to calculate the runoff volumes Q for different rainfalls P using the specified ![]() .
.
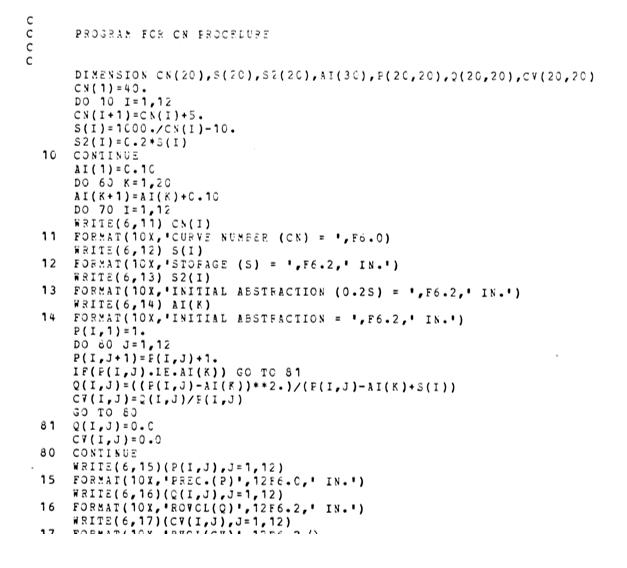
PROGRAM FOR CN PROCEDURES
The results can then also be plotted on the Q-P chart. These charts are useful for a quick comparison of CN and CN*. Since CN* are a function of the ![]() , different charts will result for different
, different charts will result for different ![]() .
.
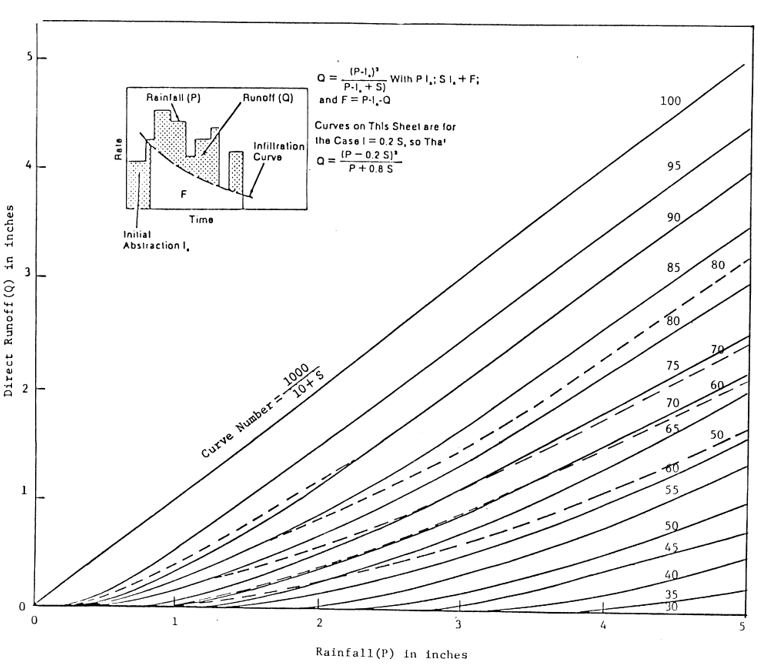
Hydrology of Runoff Equation, Q = (P-0.2S)/(P+0.8S)