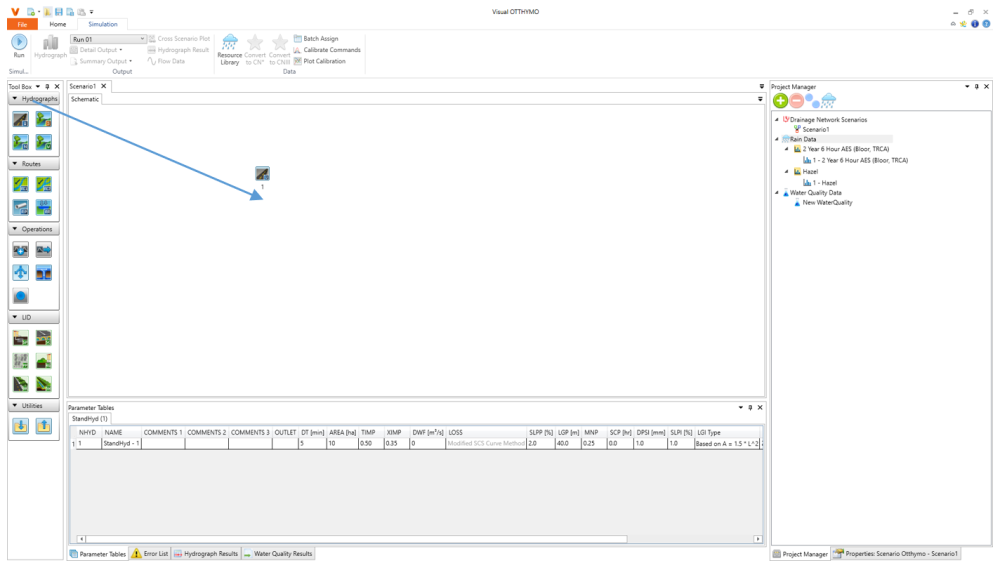
All available hydrologic objects are list in ToolBox on the left. To add one hydrologic object on canvas in Schematic View, drag and drop it onto the canvas. Then it can be moved to any location.
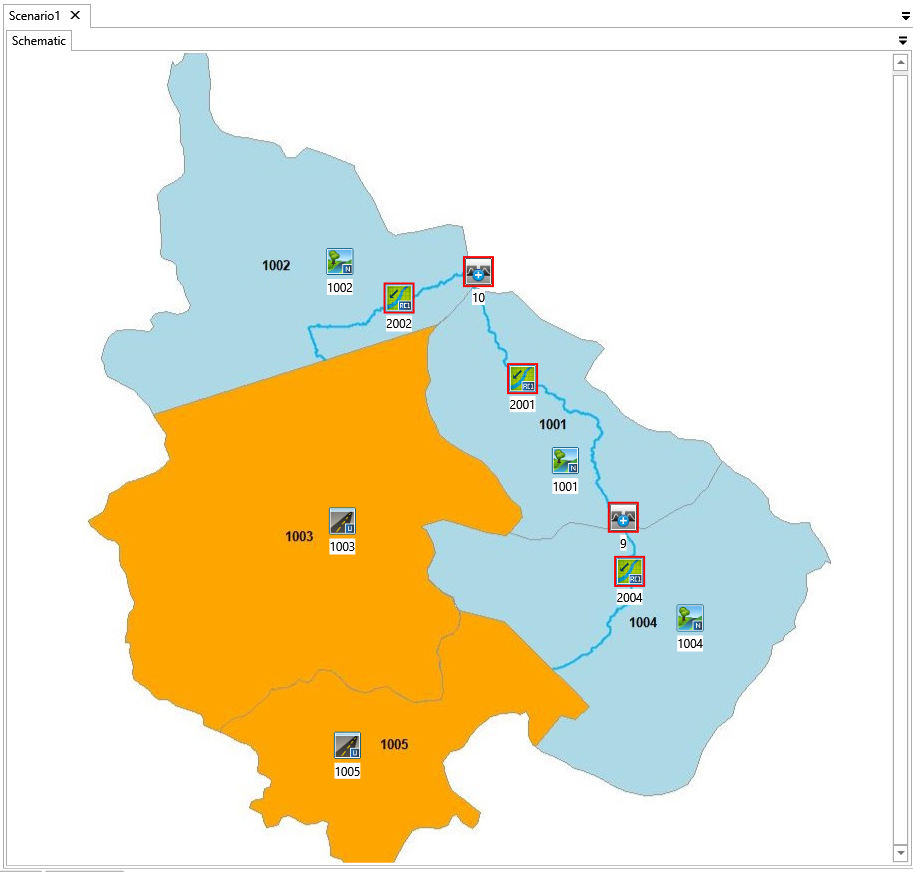
The study area has two urban catchments, three rural catchments, three channels and two con-fluence points. They can be modeled with StandHyd  , NasHyd
  , RouteChannel
  and AddHyd
  respectively. Drag and drop them from Tool Box to Canvas and move them to the proper locations based on the background. At this point, your canvas should look like the one shown below. Note that the ID of each command is labeled at the bottom and a few hydrologic object icons have red outlines indicating errors.
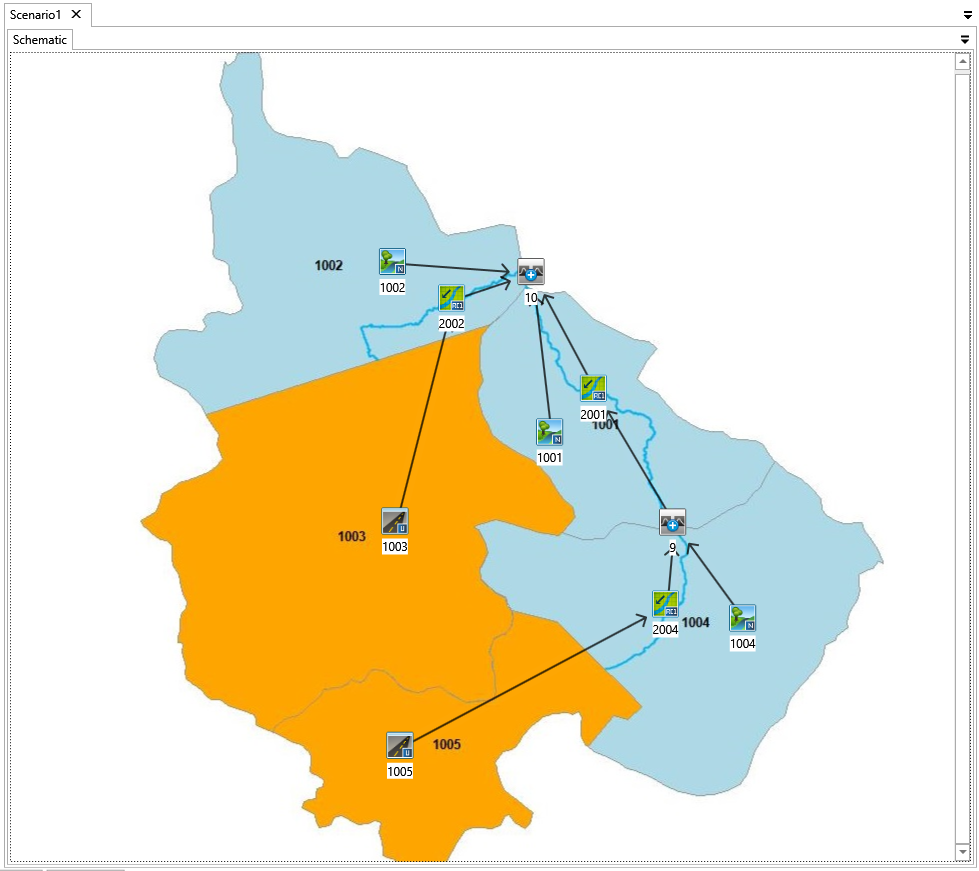
Then the drainage system components (hydrologic objects) will be connected to form a connected system. The connection between hydrologic objects tells where the flow come from and where the flow will go. On canvas, it’s represented by an arrow line pointing from the source to the destination.
In the example study area, the flow generated at catchment 1003 flows to channel 2002. The relationship is represented by a connection (or link) from StandHyd 1003 to RouteChannel 2002. To create this connection, move the cursor on top of 1003. Notice that the curve changes to a cross. Then hold the left mouse button, move to 2002 and release the left mouse button.
The connection between other hydrologic objects can also be created. At this point your canvas should look like that shown below. Note that the red outline disappears.