
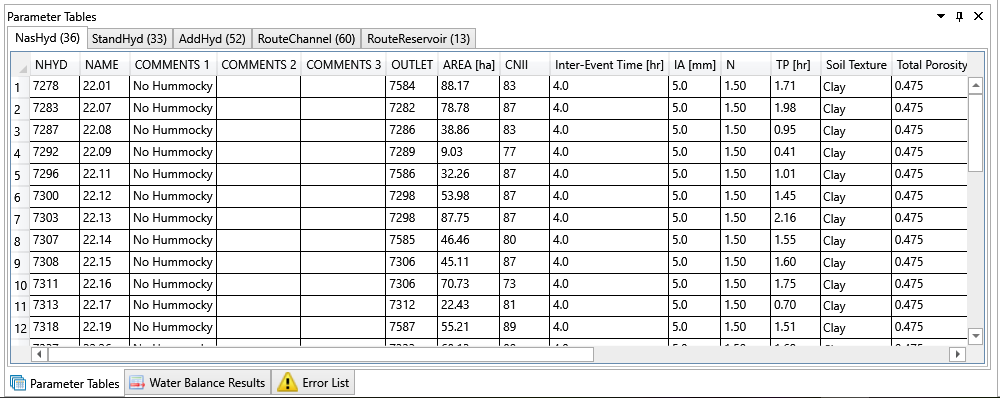
The Parameter Tables window provides a spreadsheet environment for parameter editing. By default, it’s located at the bottom of the main interface.
Parameters of each type of hydrologic object is displayed in the same table and sorted by NHYD. These tables are arranged in different tabs. The tab’s name consists of the hydrologic object name and the number of the hydrologic object in the current scenario. To view the data table of another type of hydrologic object, click on the corresponding tab.
The data record in the data table is connected to the hydrologic object. By double-clicking a data record, it will zoom to the hydrologic object in Canvas and cause this object to flash.
The value of simple parameters can be edited directly in the table. For parameters that are collection data, it’s greyed out and needs to be edited in the Properties window.
The data table can be sorted by any data column. It’s useful to find abnormal values for some parameters, e.g. slope and curve number.
The data in the data table can be copied using CTRL+C or Copy menu in context menu. Data from other sources can also be pasted using CTRL+V or Paste menu in context menu. When a data table is pasted, the first data value will be pasted to the current cell and other data values will be pasted to cells after the current cells in the horizontal and vertical directions. It’s important to make sure the parameter values in the source is same as the one in the data table before pasting.
The parameter values can also be changed by using the Field Calculator which is opened by choosing the Calculate Field … from the context menu. It’s used to change the parameter value by percentage or fixed value (replace). In Field Calculator window, all available parameters are given on the left and the formula for property change is on the right. By default, the parameter (da-ta column) highlighted in the data table is added to the formula. It can be changed to implement the changes as shown in the figure below. Click OK button to make the change.
