
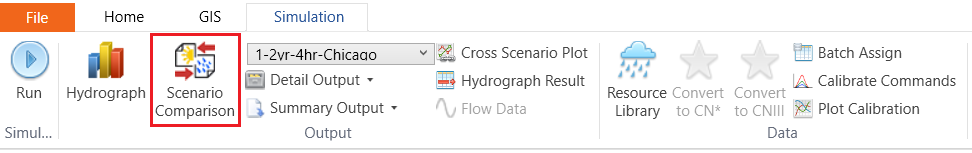
Click the Scenario Comparison button in the Simulation toolbar.
Select the Design Storm, Scenario and Commands to be compared. The chart will compare the corresponding runoff flow. For example, the figure below compares the runoff at AddHyd – 9, which is the final outlet of the entire model, of the three scenarios under the storm event “1-2yr-4hr-Chicago”. It can be seen that after applying LID, the peak flow under the post-development is reduced to the level similar as that under the pre-development.

Copyright © 2024 Smart City Water
—
Powered by 