
Scenario Comparison tools allows to compare model results of different scenarios at a certain location. For example, you could compare the peak flow at your site outlet from pre-development condition and post-development condition with a pond. Engineers could setup the comparison in the submitted model for reviewers to open directly for verification. This tool is available for both single-event and continuous simulation.
To use the Scenario Comparison tool:
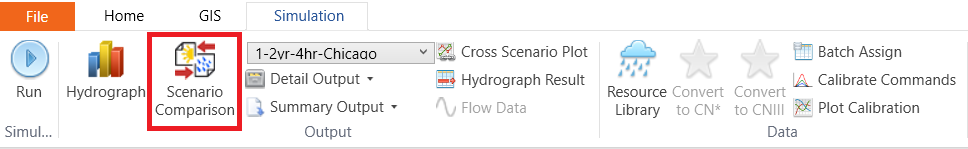
1. Navigate to Simulation toolbar and click the Scenario Comparison button 
2. In the popped-up window choose the Design Storm from the drop-down list, check off the Scenarios that you want to include the Graph and Statistics table, and select the Command that you are interested to make a comparison.

In Continuous Project, there are special analysis results for Wetland and RouteChannel. Please refer to:
Wetland in Continuous Project – Hydroperiod and Inflow Mass Curve
RouteChannel in Continuous Project – Erosion Analysis
3. Export the Statistics table as a CSV file by clicking the Export button
4. Click the Save button. In the popped-up window, type a name for the comparison chart.

5. The current Scenario Comparison will be saved in the Project Manager under the Scenario Comparison group ![]() . To open the same scenario comparison, simply double click on the saved item.
. To open the same scenario comparison, simply double click on the saved item.
