
The Hydrograph Results and Water Balance Results window is the same window which appears differently for single-event simulation and continuous simulation. By default, this window is at the bottom of the main interface. It’s used to show the summary results of each hydrologic object.
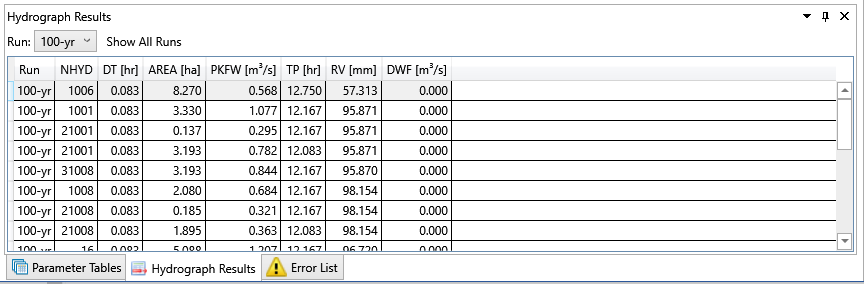
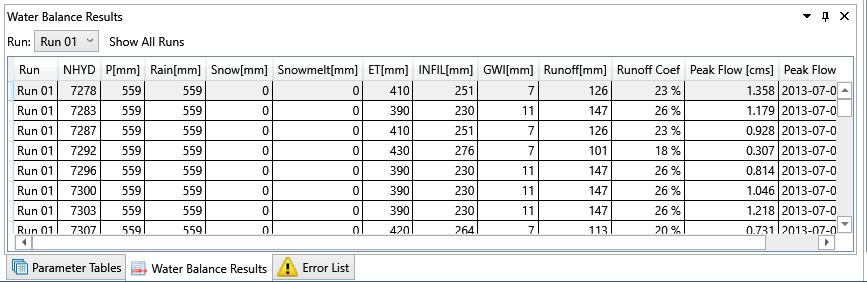
For single-event simulation, the summary is the peak flow and runoff volume of the hydrograph. For continuous simulation, it’s the peak flow and average annual amount of each water balance component. The summaries are shown in a data table for each available hydrological object. Data can be sorted by any column.
In case there are multiple simulation runs, only summary results of select run (selected in scenario property) is shown in the table. To switch to another run, select the run from the drop-down list above the data table. It’s possible to show summary results of all runs by clicking on the Show All Runs button.
Same as Parameter Tables window, the hydrologic object can be zoomed in by double-clicking on the data record.