
In the Data tab, users can configure and customize the data series that will be displayed on the chart.
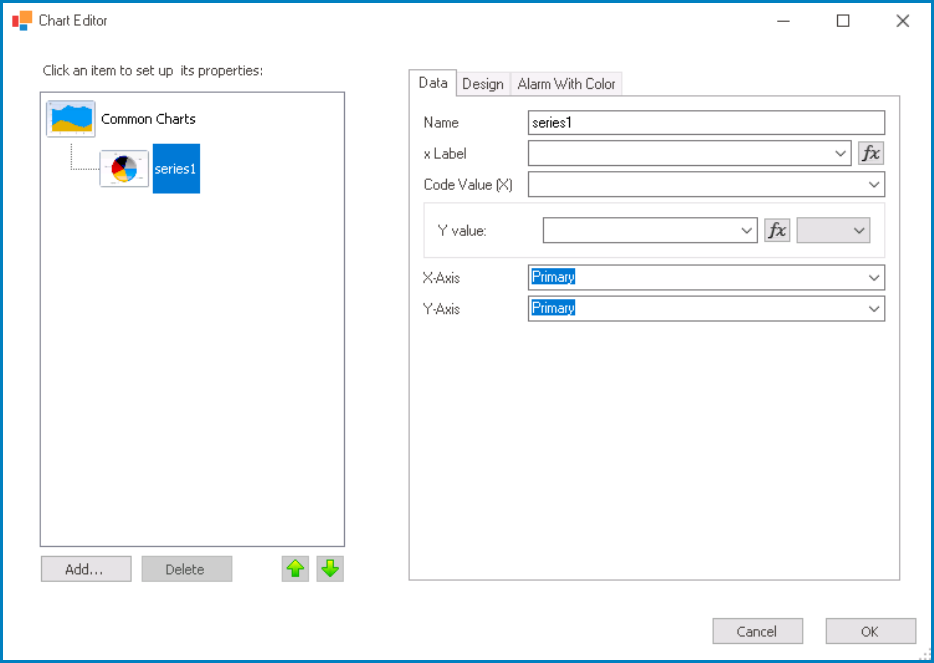
- Name: This is a text field that allows users to input the name of the data series.
- X Label: This is a single-select dropdown field that retrieves the list of columns associated with the selected data source. It allows users to select a column to use as the x-axis label for the chart.
- Code Value (X): This is a single-select dropdown field that retrieves the list of columns associated with the selected data source. It allows users to select a column to use as the x-axis data for the chart.
- Y Value: This is a single-select dropdown field that retrieves the list of columns associated with the selected data source. It allows users to select a column to use as the y-axis data for the chart.
- X-Axis: This is a single-select dropdown field that displays the list of axis positions or placement options. It allows users to select whether the x-axis is the primary or secondary axis for the chart.
- Y-Axis: This is a single-select dropdown field that displays the list of axis positions or placement options. It allows users to select whether the y-axis is the primary or secondary axis for the chart.