In the Design tab, users can customize the visual appearance of their chart.
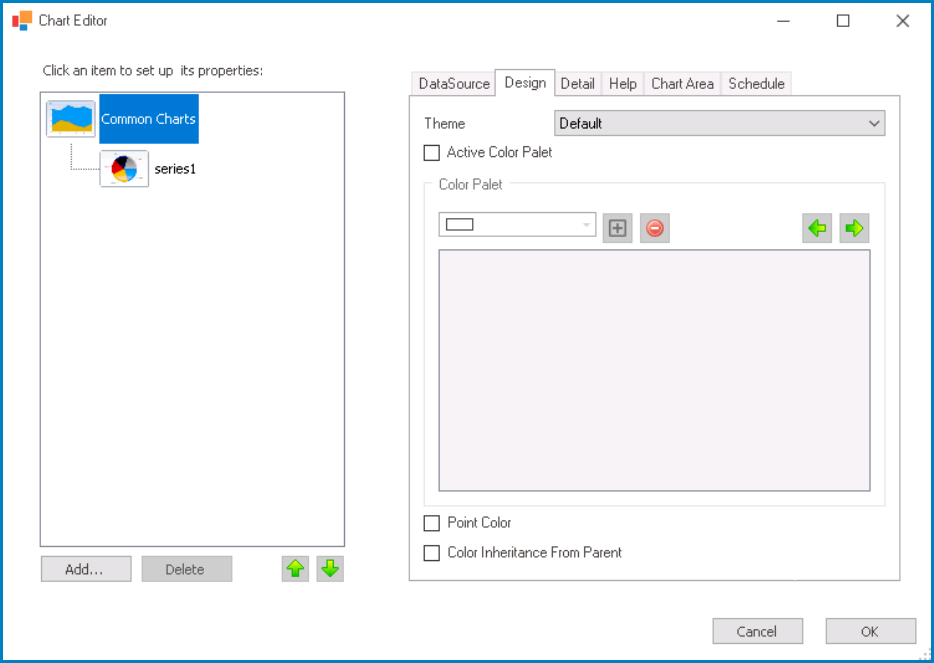
- Theme: This is single-select dropdown field that displays a list of pre-defined color schemes. It allows users to choose a color scheme for the chart.
- Active Color Palette: This is a checkbox which, if selected, allows users to apply a color palette to the chart.
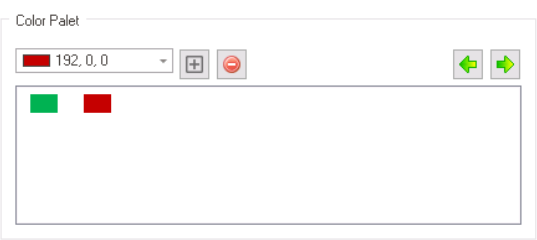
- Color Palette: In this section, users can manage and customize the color palette for the chart.
- To add a new color to the palette, first select it from the color picker and then click on the
![]() button.
button.
- Once selected and added, colors are displayed in a box inside the section, which represents the current color palette being used by the chart.
![]()
- Once selected and added, colors are displayed in a box inside the section, which represents the current color palette being used by the chart.
- To remove a color from the palette, select it from the box and click on the
![]() button.
button. - To rearrange the order of a color, select it from the box and click on the
![]() or
or ![]() button. This will move the selected color one position to the right or the left, respectively.
button. This will move the selected color one position to the right or the left, respectively.
- To add a new color to the palette, first select it from the color picker and then click on the
- Point Color: This is a checkbox which, if selected, allows users to apply the selected color palette to the individual data points on the chart.
- Color Inheritance from Parent: This is a checkbox which, if selected, allows the child elements of the chart (such as data points, legends, and labels) to inherit their color from the parent element (the chart).
- If this checkbox is selected, it will disable the Active Color Palette checkbox.
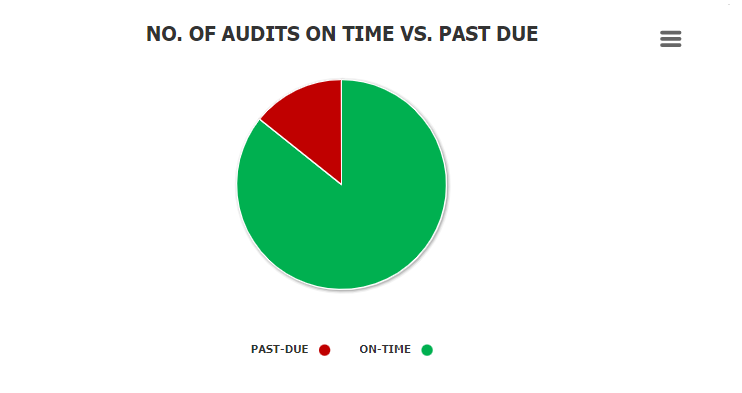
- Interactive Chart Color Palette Preview: Web View
-
![]()