In the Help tab, users can customize the chart’s labels and tooltips using HTML tags.
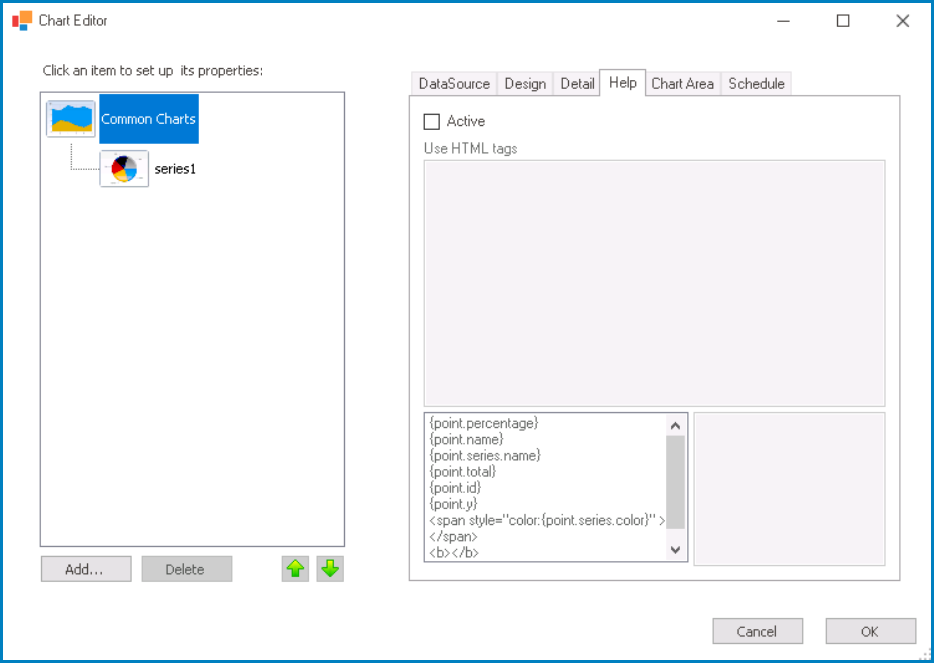
- Active: This is a checkbox which, if selected, allows users to enable the use of HTML tags in the chart’s labels and tooltips.
- If this checkbox is selected, it will enable the Use HTML Tags field.
- Use HTML Tags: This field allows users to customize the text of the chart’s labels and tooltips using HTML tags.
- Users can quickly add formatting and content to their chart labels and tooltips by choosing a tag from the scrollable list box displayed below this field.
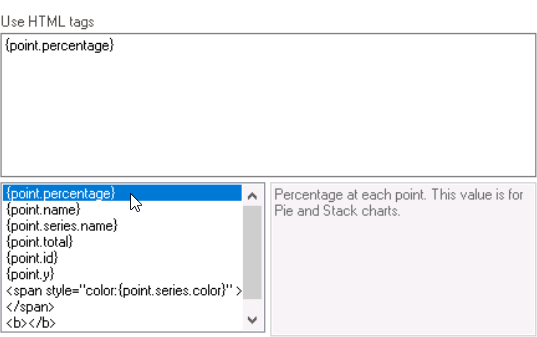
- When a tag is selected from this list, it will automatically populate the Use HTML Tags field with the appropriate syntax. Users can then customize the tag by modifying the text within the tags or adding additional tags to the text field.
![]()
- The selected tag’s information is displayed in the adjacent box field, providing guidance on how to use it.
- When a tag is selected from this list, it will automatically populate the Use HTML Tags field with the appropriate syntax. Users can then customize the tag by modifying the text within the tags or adding additional tags to the text field.
- Users can quickly add formatting and content to their chart labels and tooltips by choosing a tag from the scrollable list box displayed below this field.
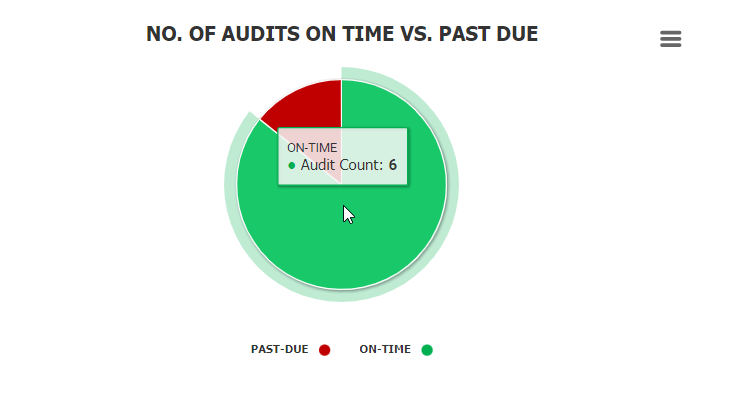
- Interactive Chart Labels and Tooltips Preview: Web View
-
![]()