
In the Data tab, users can customize the map display by choosing the desired map and configuring fields to tailor the visualization of geographic data. Users can also select and configure the data source for the control, including any necessary query parameters.
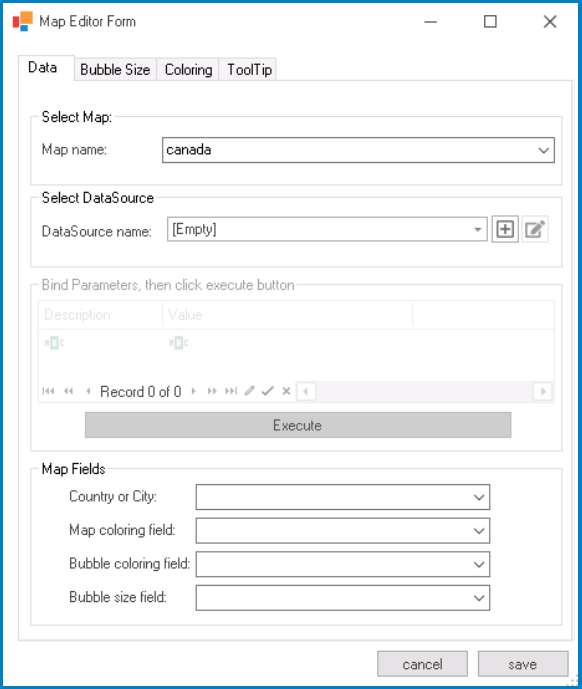
- Select Map: In this section, users can choose the map to be displayed in the map control, defining the scope and geographic context for their data visualization.
- Map Name: This field allows users to select the specific map they want to display from a dropdown menu.
- By choosing a particular map, users can visualize data at different geographical levels, whether country-specific, continent-specific, or global.
- By choosing a particular map, users can visualize data at different geographical levels, whether country-specific, continent-specific, or global.
- Map Name: This field allows users to select the specific map they want to display from a dropdown menu.
- Select DataSource: In this section, users can select the data source for the map control.
- DataSource Name: This dropdown retrieves the list of data sources (from both the Dropdown Data Sources section of the Forms module and the KPIs section of the Entities module). It allows users to select the data source for the map control.
- To define a new data source, select the
![]() button.
button.
- It will display the KPI Properties window.
- To modify an existing data source, select the
![]() button.
button. - To remove a selected data source, select the
![]() button.
button.
- To define a new data source, select the
- DataSource Name: This dropdown retrieves the list of data sources (from both the Dropdown Data Sources section of the Forms module and the KPIs section of the Entities module). It allows users to select the data source for the map control.
- Bind Parameters & Execute: In this section, users can set parameters for the query and execute it with the selected data source.
- Parameters are values that are used to filter or modify the data returned by the query.
- If the selected data source has a parametric query (i.e., a query that contains parameter placeholders), users can enter the parameter names in the Description column and the corresponding values for the parameters in the Value column.
- Execute: This button allows users to run or execute the parametric query with the selected data source and the specified parameter values.
- When the query is executed, it uses the provided parameter values to filter or modify the data from the selected data source.
- Parameters are values that are used to filter or modify the data returned by the query.
- Map Fields: In this section, users can map specific fields to columns in the selected data source, thereby configuring the map display and data visualization accordingly.
- Country or City: This dropdown retrieves the list of columns associated with the selected data source. It allows users to select the column that contains codes representing continents, countries, or cities (depending on the chosen map).
- By mapping this field, users can define how the map visually associates data points with specific continents, countries, or cities.
- By mapping this field, users can define how the map visually associates data points with specific continents, countries, or cities.
- Map Coloring Field: This dropdown retrieves the list of columns associated with the selected data source. It allows users to select the column that determines the coloring of map elements (continents, countries, or cities).
- By mapping this field, users can visually represent variations in data through colors or shading, emphasizing different aspects of their data.
- By mapping this field, users can visually represent variations in data through colors or shading, emphasizing different aspects of their data.
- Bubble Coloring Field: This dropdown retrieves the list of columns associated with the selected data source. It allows users to select the column that determines the coloring of bubbles for each map element (continent, country, or city).
- By mapping this field, users can highlight specific attributes or categories within the data, allowing for clearer differentiation and visualization.
- By mapping this field, users can highlight specific attributes or categories within the data, allowing for clearer differentiation and visualization.
- Bubble Size Field: This dropdown retrieves the list of columns associated with the selected data source. It allows users to select the column that determines the size of the bubbles for each map element (continent, country, or city).
- By mapping this field, users can visually convey varying magnitudes or quantities within the data, providing a clear representation of relative values.
- By mapping this field, users can visually convey varying magnitudes or quantities within the data, providing a clear representation of relative values.
- Country or City: This dropdown retrieves the list of columns associated with the selected data source. It allows users to select the column that contains codes representing continents, countries, or cities (depending on the chosen map).