
To plot the hydrograph, select the Outfall node O2. Click the Plot Results button in the Simulation tab. In the pop-up window, select the rain event for which you want to view the results from the Run drop-down list. Change Variables to Total Inflow.

We can also view the results in the Result Summary Tables. Click the Result Summary Tables tab, which by default is located at the bottom of the VOSWMM main interface. Click Subcatchment tab and check on Show All Runs to list the summary results of all runs.
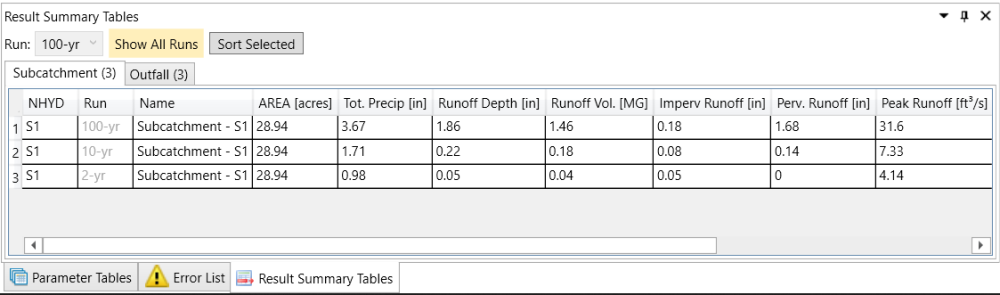
From the Result Summary Tables of the Subcatchment, we can see that the increasing rate of runoff volume Runoff Vol. from 2-year return period to 100-year return period is faster than that of rainfall volume Tot. Precip.. The reason could be that the soil is more saturated in larger event.