
Hydrographs
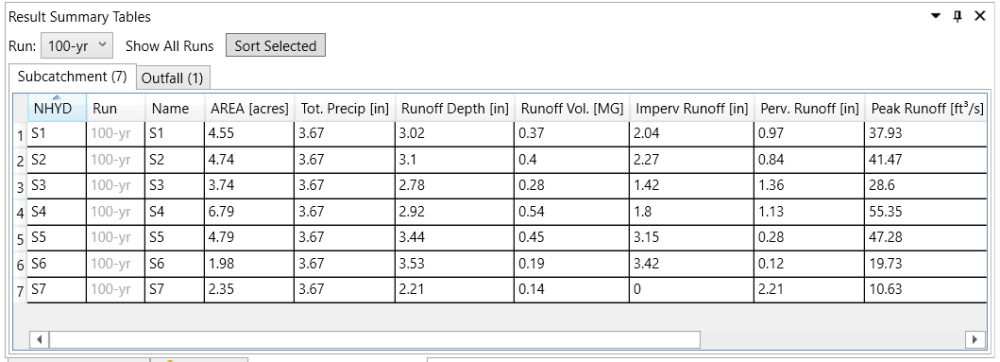
We can view the summary results in the Result Summary Tables in the same fashion as for the pre-development condition. Select the run to view results in the Run dropdown list and click the header of NHYD to sort the table by subcatchment NHYD.
Pre- and Post-Development Comparison
To compare hydrographs of pre- and post-development, select the Outfall node and then click the Scenario Comparison button in the Simulation toolbar. In the pop-up window, select the Run to be compared in the Design Storm drop-down list and choose Total Inflow in the Variables. The comparison Graphs and Statistics table will display. Set the color of “developed” as red and “undeveloped” as green. Users can also save the comparison results to the Scenario Comparison group in the Project Manager by clicking the Save button on the Scenario Comparison window.
