
Select Junction NHYD 6 and 9 on the canvas. Then, click the Elevation Profile button in the Simulation tab.
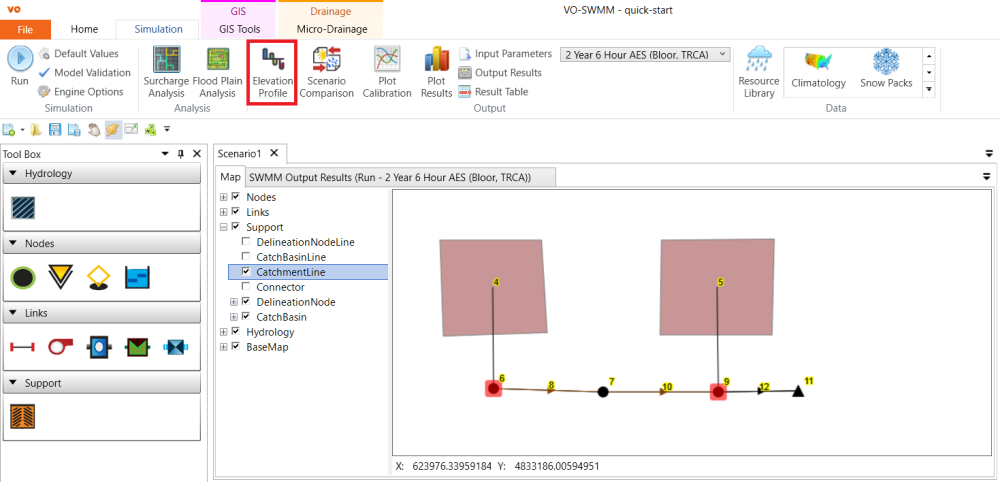
The Elevation Profile will show in a new tab.
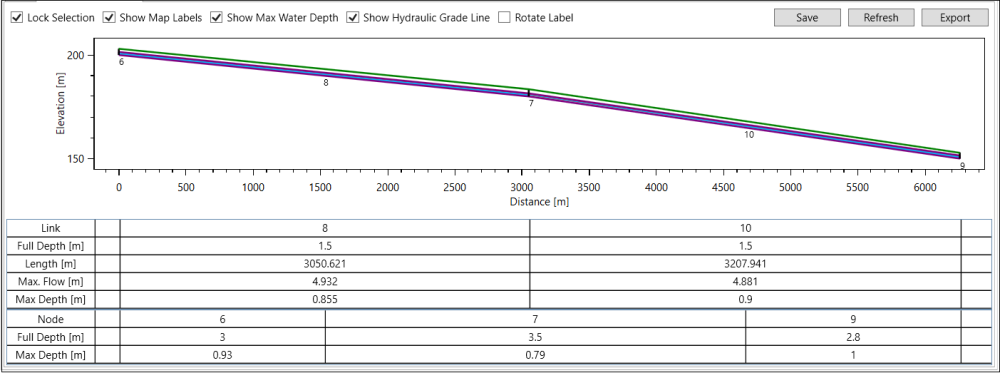
- if Lock Selection box is unchecked, the profile plotting will be updated with the selection on the map. If you do not want to update the plotting of elevation profile, check the Lock Selection box.
- scroll mouse middle wheel to zoom into the graph
- click on the node/link column to zoom into that object on the graph and show the Properties tab of that object
![]()
Copyright © 2025 Smart City Water
—
Powered by 