Surcharge Analysis
Click the Surcharge Analysis button. In the pop-up window, in the drop-down list of Run select the “RainData”. Click Run.
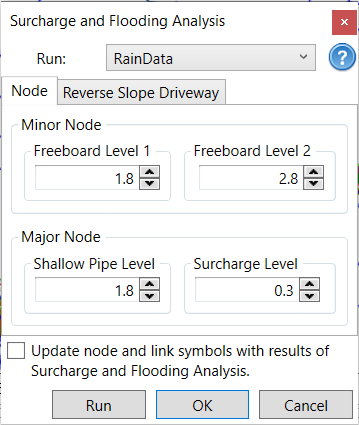
The Surcharge Analysis result will be updated to the nodes and links in the Parameter Tables and Properties tab.
For the minor system, there are four levels from the surcharge analysis result:
- No surcharge: the node is not surcharged. By default, the symbol is green circle dot.
- Surcharge Below Freeboard 2: the node is surcharged, and the water level is below Freeboard 2. By default, the symbol is yellow circle dot.
- Surcharge Between: the node is surcharged, and the water level is between the Freeboard 2 and Freeboard 1. By default, the symbol is orange circle dot.
- Surcharge Above Freeboard 1: the node is surcharged, and the water level is above the Freeboard Level 1. By default, the symbol is red circle dot.
For the major system without reverse driveway, there are two levels from the surcharge analysis result:
- No surcharge: the node is not surcharged
- Surcharge: the node is surcharge and the water depth is above the value given in the field Surcharge Level under the Major Node section
Flood Plain Analysis
Click the Flood Plain Analysis button in the Simulation tab. Set up the parameters as below and choose the file path and file name (“floodplain”) in the Output Filepath field to save the flood plain.

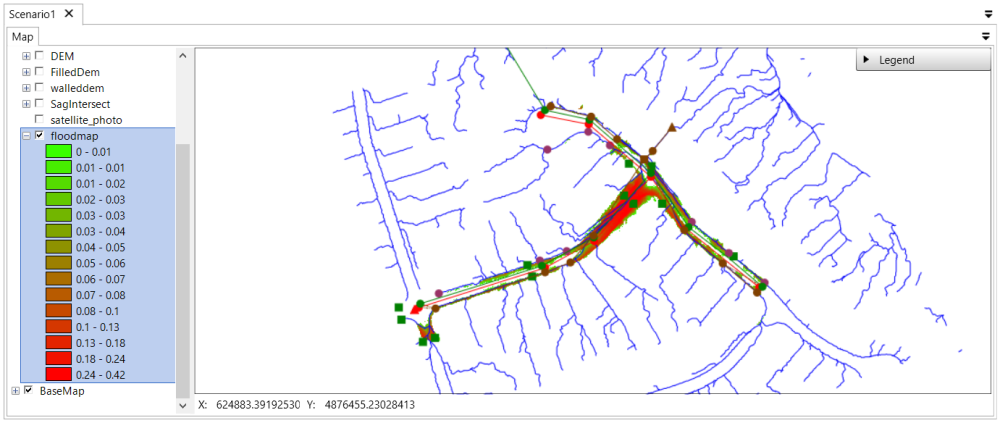
Click OK run the flood plain analysis. Once it is done, a flood plain raster in the name give in the Output Filepath, in this case “floodplain”, will be added to the layer table of the map. To see the generated Flood Plain, un-check the subcatchment layer, sag layer and other raster layers on the top of the flood plain raster, and hide flow path arrows.