
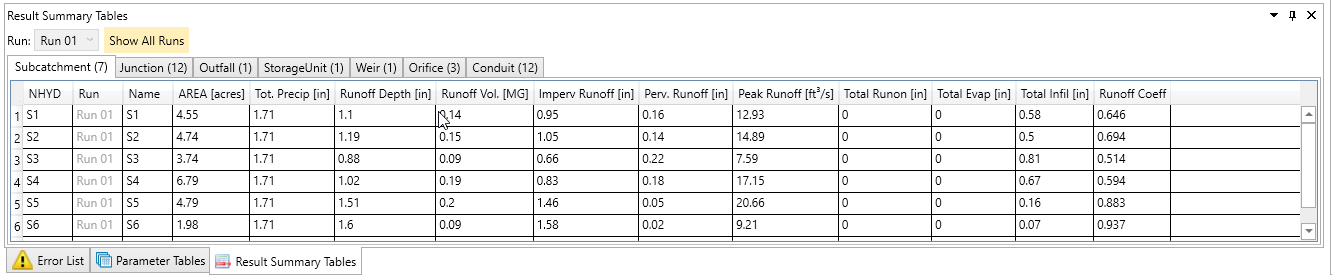
Result Summary Tables window provides a spreadsheet environment for showing/editing SWMM simulation result. By default, it’s located at the bottom of the main interface. It can be toggled on/off via Tool Bar > Home > Windows.
Result Summary Tables will be reset and updated every time a simulation run has been executed. Please refer to Simulation – Run and Options for instruction on how to executing a simulation run.
- Table Structure
- The summary results are grouped by types of hydrologic objects and grouped by Runs of current scenario. These tables are arranged in different tabs by the type of objects. The name of the tab is the hydrologic object type and the number of that type of hydrologic objects in current scenario.
- Select the Run from the drop-down list of Run to show the summary results of that run. Click on Show All Runs to show results from all runs in the table.
- Select in the Table
The data record in the data table is connected to the hydrologic object.- Mouse Single-click will highlight corresponding hydrologic object on Schematic View or Map View. Hold CTRL or SHIFT key for Multiple selection. The selected objects will be highlighted on Schematic View or Map View.
- Double-click one row in the table would flash and zoom to the hydrologic object on Schematic View or Map View.
- Select objects on the Schematic or Map view will also highlight the selected objects in the table.
- Sort the Table
- Sort by column header: click on the table header to sort the table by that column. Click the header once to sort the table by that column in an ascending way; click again to sort in a descending way. The table could be sorted by any data column. It’s useful to find abnormal values for some parameters, e.g. Max Flow.
- Sort Selected: click the Sort Selected button to sort the selected objects on the top of the table. First, select objects on the Map or Schematic View, and then, click the Sort Selected button.
- Edit in the Table
Please note that it is not recommended to change simulation results directly in the Results Summary Tables, though some of them can be changed in the Result Summary Tables.
To change the results of variables select the cell by clicking on it and then clicking once more. None editable values is greyed out in the table.
Copyright © 2025 Smart City Water
—
Powered by 