
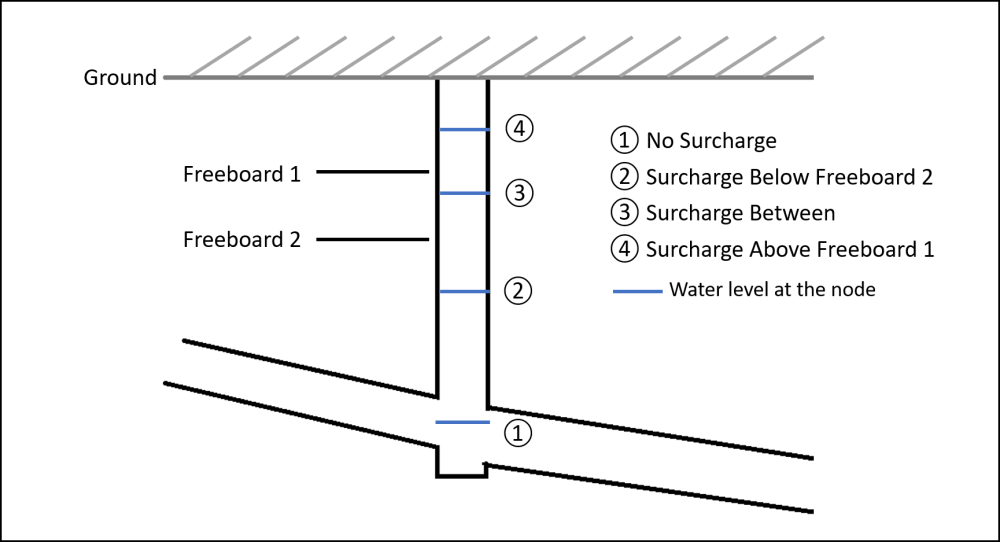
Click the Surcharge Analysis button. In the pop-up window, in the drop-down list of Run select the run whose simulation results are to be analysis, and type in critical depth for the surcharge analysis. Click Run button to run surcharge analysis. The field Freeboard Level 1 is the distance from the Freeboard 1 to the ground and the field Freeboard Level 2 is the distance from the Freeboard 2 to the ground. When users do not want to differentiate two levels of freeboards, type the same number in the two fields.
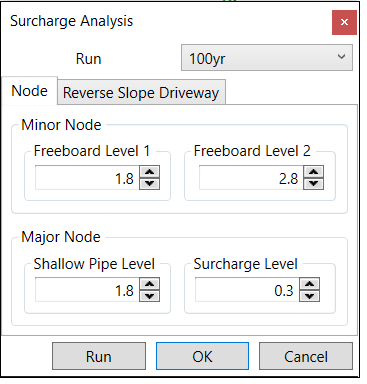
For the minor system, there are four levels from the surcharge analysis result:
- No surcharge: the node is not surcharged. By default, the symbol is green circle dot.
- Surcharge Below Freeboard 2: the node is surcharged, and the water level is below Freeboard 2. By default, the symbol is yellow circle dot.
- Surcharge Between: the node is surcharged, and the water level is between the Freeboard 2 and Freeboard 1. By default, the symbol is orange circle dot.
- Surcharge Above Freeboard 1: the node is surcharged, and the water level is above the Freeboard Level 1. By default, the symbol is red circle dot.
For the major system without reverse driveway, there are two levels from the surcharge analysis result:
- No surcharge: the node is not surcharged. By default, the symbol is green circle dot.
- Surcharge: the node is surcharge and the water depth is above the value given in the field Surcharge Level under the Major Node section. By default, the symbol is red circle dot.
Reverse Slope Driveway
The Reverse Slope Driveway tool analyzes the risk of flooding in driveways that slope downwards toward a garage or house, which can be particularly vulnerable to flooding.
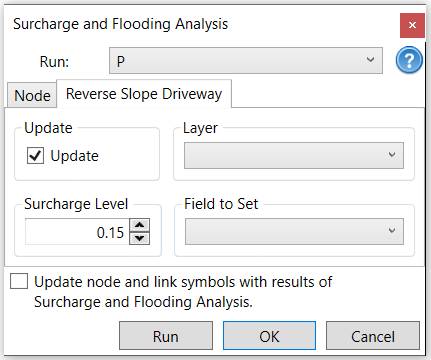
You need to check on Update, select the driveway layer (it is a point layer), and select a field (it is a string field) from the driveway layer. In other words, you want to update the analysis with the reverse slope driveway data.
- Layer: This should be the layer that represents the reverse slope driveways in your model. It is a point layer.
- Field to Set: This field will store the results of the flood analysis for each driveway.
The “Field to Set” will store the results of the flood analysis for each driveway. The values will indicate whether the driveway is surcharged or not, and to what extent. The “Field to Set” in the Reverse Slope Driveway tool refers to the specific attribute within your selected layer where the results of the flood analysis will be stored.
Example: If you have a shapefile for reverse slope driveways with attributes like ID, Location, Type, and FloodStatus, you would select FloodStatus as the “Field to Set.” This field will then store values such as “No Surcharge,” “Surcharge Level 1,” or “Surcharge Level 2” based on the analysis.
Run Analysis: The tool will loop through each node and link, calculate the flood analysis depth, and assign the appropriate surcharge level to the field.
The tool will find the nearest driveway shape to each junction (node) and assign the flood analysis results to the corresponding field in the driveway layer.
If Flood Analysis Depth is greater than or equal to Major Node Surcharge Level, the node is classified as having a Major Surcharge Level 2.
If Flood Analysis Depth is less than Reverse Slope Driveway Surcharge Level, the node is classified as having No Surcharge.
If Flood Analysis Depth is between Reverse Slope Driveway Surcharge Level and Major Node Surcharge Level, the node is classified as having a Major Surcharge Level 1.