
In case that users have their own raster files and want to obtain time-series rainfall data from those raster files, they can use the Obtain Rainfall from Raster tool.
- Select subcatchment whose rainfall data to be obtained from raster files. Note that the selected catchments must be assigned to a geometry. If no subcatchments are selected by users, the tool will run the calculation for each of all the catchments.
- Navigate to GIS Tools ribbon. Click the small triangle under the DRMT tool to expand the list. Click Obtain Rainfall from Raster button to open the tool window.
![]()
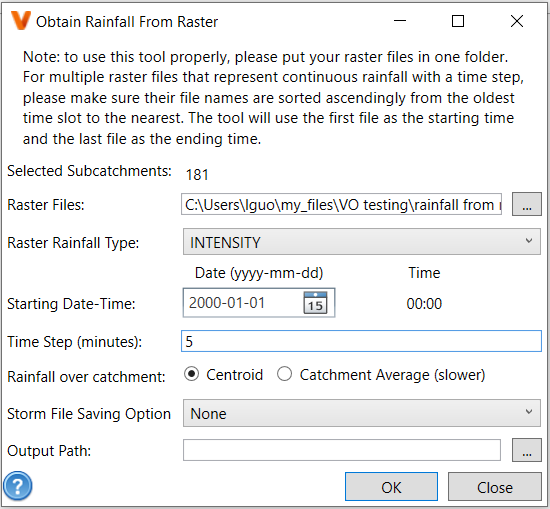
- The number of catchments to be processed is given at top of the tool interface.
![]()
Please refer to the table below for parameter settings.
Parameter Description Raster Files Click the button ![]() to open the file navigation window. Navigate to raster file location. Select the raster files to be processed. For multiple selection, hold Ctrl to click and select files. The directory path of the raster files will be shown in the field of Raster Files on the tool interface. Please note that the names of files should be arranged according to time sequence. The first raster will be used to generate the rainfall at the first time slot, the second raster for the second time slot, etc.
to open the file navigation window. Navigate to raster file location. Select the raster files to be processed. For multiple selection, hold Ctrl to click and select files. The directory path of the raster files will be shown in the field of Raster Files on the tool interface. Please note that the names of files should be arranged according to time sequence. The first raster will be used to generate the rainfall at the first time slot, the second raster for the second time slot, etc. Raster Rainfall Type Select which type of data these raster files represent, either Intensity or Volume rainfall measurement. If the rainfall type of raster files are Intensity, the Rain Format of generated storm data will also be Intensity. If the rainfall type of raster files are Volume, the Rain Format of generated storm data will also be Volume. Time Step and Starting Date-Time The tool will use the 1st raster file (i.e. the 1st raster will be identified based on its file name) to get the rainfall data at the time Starting Date-Time, the 2nd raster file to get the rainfall data at the time slot of Starting Date-Time plus Time Step, the 3rd raster file to get the rainfall data at the time slot of Starting Date-Time plus Time Step multiplied by 2, etc. Rainfall over catchment The method to calculate the rain fall over catchment using the rainfall surface. It can be centroid or catchment average. Centroid uses the rainfall at the catchment polygon centroid. Catchment Average calculates the average rainfall over the catchment. The centroid is the default value. Storm File Saving Option Choose whether or not to save storm data generated from the tool to csv files. It can be None, Single File or Multiple Files. None means not to save storm data to csv files. Single File means to save the storm data for all subcatchments into one csv file. Multiple Files means to save storm data into separate csv files and each csv file contains the result of one subcatchment. Output path Folder for generated storm csv files
 to open the file navigation window. Navigate to raster file location. Select the raster files to be processed. For multiple selection, hold Ctrl to click and select files. The directory path of the raster files will be shown in the field of Raster Files on the tool interface. Please note that the names of files should be arranged according to time sequence. The first raster will be used to generate the rainfall at the first time slot, the second raster for the second time slot, etc.
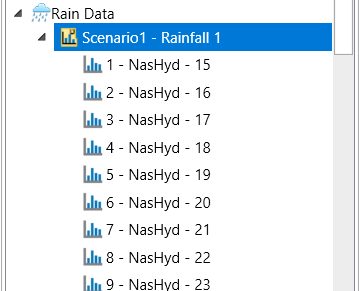
 - After the process finishes, a new rain subgroup is created and added to the Rain Data group in Project Manager. The number of rain datasets in this new rain subgroup matches with the number of processed subcatchments.
![]()
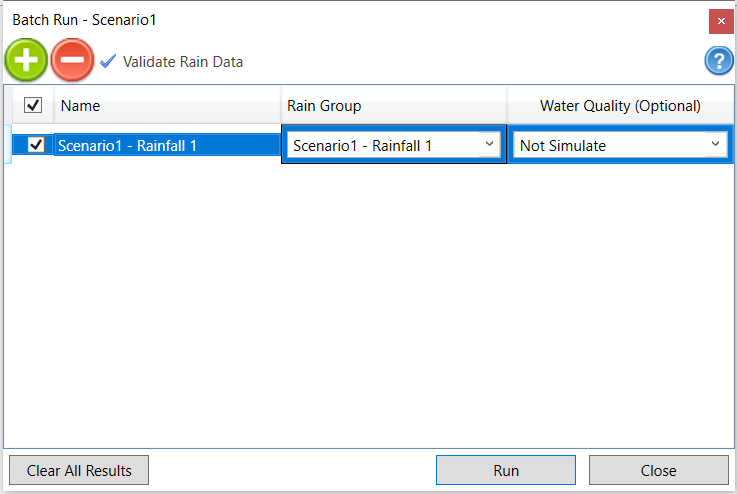
- The generated rain groups can be used to run the simulation as other rain groups. In Batch Run window through the Run button in the Simulation tab, select the rain group from the Rain drop down list as shown below.
![]()
Copyright © 2025 Smart City Water
—
Powered by 