
We’re broadening the focus of Example 2, which originally examined a 29-acre urban catchment and drainage system, to include water quality modeling. This expansion involves simulating pollutant buildup, washoff, and routing to assess water quality at the catchment outlet post-development, without any runoff controls in place. The study area is depicted in Figure 5-1, and we’ll modify the input file, named Example2-Post.inp, to include water quality considerations.
Analyzing long-term precipitation data reveals that most storms are small. In Example 3, a detention pond in Colorado had a water quality capture volume (WQCV) of only 0.23 inches, exceeded by just 25% of storms. This volume is a mere 25% of the 2-year design storm used in previous examples (1.0 inch). Hence, it’s the smaller, more frequent storms that account for a substantial portion of stormwater runoff and pollutant loads in urban catchments (UDFCD, 2001).
To study the impact of storm volume on pollutant loading, this example will calculate runoff loads from two smaller 2-hour storms, one with a 0.1-inch volume and the other with a 0.23-inch volume. These results will be compared to the runoff loads from the 2-year design storm used in previous examples, which had a 1.0-inch volume. The table in Figure 5-1 displays the intensity data at five-minute intervals for these smaller storms.
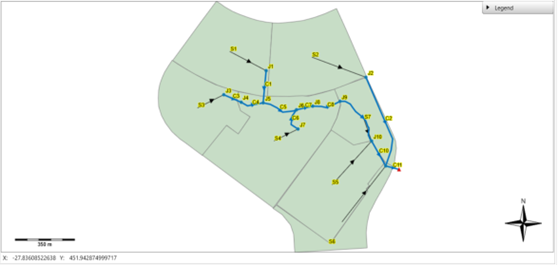
Figure 5-1

Note:
To add the storms in the model, click on Library Resource. Then, manual input and enter the values.

In VOSWMM, we define these new rainfall patterns, named “0.1 Design Storm” and “0.23 Design Storm” They will supplement the model’s single rain gauge, alongside the 2-year storm, omitting the 10-year and 100-year storms used previously.