
We’ll discuss results from various runs comparing TSS treatment in LIDs. Starting with filter strip S_FS_1, during a 0.1-inch storm, the TSS concentration in treated runoff dropped from 170 mg/L to 51 mg/L, in line with the 70% removal efficiency specified for LIDs. Similar outcomes were seen in other filter strips across different storm scenarios.
We also observed this pattern in infiltration trench S_IT_4, treating runoff from subcatchment S2.3 during a 2-year (1 inch) event. With a 70% removal rate, the TSS concentration dropped from 210 mg/L to 63 mg/L, as seen in the other infiltration trenches for similar storms.
The next step is to assess how well the detention pond treats different design storms. Directly comparing the TSS concentrations between the inflow and treated outflow over time is not very informative due to differing flow rates. Instead, we’ll compare the TSS concentration in the pond’s outflow, both with and without treatment, for each design storm.
Here are the key findings:
- With a k-value of 0.01 ft/hr, the pond effectively removes nearly all settleable solids within 40 hours during the WQCV storm (0.23 in).
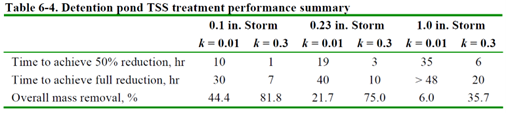
- Treatment becomes less effective as the size of the 2-hour design storm increases due to deeper water depths in the pond.
- Regardless of storm size, it takes a considerable amount of time for significant TSS removal: 10, 19, and 35 hours are needed to achieve a 50% reduction in settleable TSS for the 0.1 in, 0.23 in, and 2-year storms, respectively.
Another way to gauge the pond’s treatment effectiveness is by comparing the mass of TSS it releases with and without treatment. For the 0.23 WQCV storm, treatment only removed 15.7 lbs out of 72.5 lbs of washed-off TSS, resulting in a modest 21.7% overall mass reduction. Similar trends were seen for other storms: 44.4% for the 0.1 in. storm and 6% for the 2-year (1 in.) storm. These limited reductions are because it takes a long time for solids to settle in the pond, during which it continues to release treated outflow.
The detention pond’s performance is considered modest. This assessment was based on a removal constant (k) that represents particles with very slow settling velocities, even slower than the slowest 20% observed in a nationwide survey. Now, if we consider larger particle sizes with a higher k-value of 0.3 ft/hr (representing the 40th percentile of settling velocities from the NURP study), we see different TSS concentrations in the pond discharge and TSS discharge loading for the 0.23 in. event. Table 6-4 summarizes the pond’s treatment performance for both k-values.
These findings emphasize that uncertainty in the removal constant can significantly affect predictions of TSS removal in the detention pond. Unfortunately, as indicated in the US EPA (1986) study, solids’ settling velocities can vary widely between sites and even within the same site during different storms. This variability makes it challenging to reliably estimate the detention pond’s treatment effectiveness.
Lastly, a comparison reveals the total pounds of TSS discharged from the study area site for each design storm under different treatment scenarios: no treatment, treatment with only LIDs, and treatment with both LIDs and the detention pond. These assessments are based on the analysis of each storm with (a) both types of treatment, (b) LID treatment alone, and © no treatment using an assigned k-value of 0.01 ft/hr.
Interestingly, even though the pond handles all runoff from the catchment while LIDs only manage runoff from 41% of the catchment area, the pond contributes less to overall load reduction. This is mainly due to the conservative k-value used in the pond’s treatment model. A higher k-value, which indicates a larger particle size distribution in runoff, would result in lower loadings from the pond.