
Horton and Modified Horton
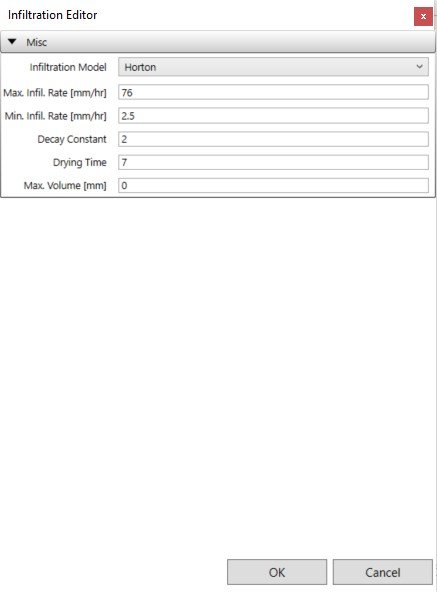
- Max. Infil. Rate: The maximum infiltration rate on the Horton curve, measured in inches per hour (in/hr) or millimeters per hour (mm/hr).
- Min. Infil. Rate: The minimum infiltration rate on the Horton curve, equivalent to the saturated hydraulic conductivity, measured in in/hr or mm/hr. Typical values can be found in the Soil Characteristics Table.
- Decay Const.: This parameter represents the infiltration rate decay constant for the Horton curve, measured in 1/hours. Typical values range from 2 to 7.
- Drying Time: The time, in days, it takes for fully saturated soil to dry completely. Typical values range from 2 to 14 days.
- Max. Infil. Vol.: The maximum infiltration volume possible, measured in inches or millimeters. It can be estimated based on the difference between a soil’s porosity and its wilting point times the depth of the infiltration zone.
Representative Values for Max. Infiltration Rate:
A. DRY soils (with little or no vegetation):
Sandy soils: 5 in/hr
Loam soils: 3 in/hr
Clay soils: 1 in/hr
B. DRY soils (with dense vegetation):
Multiply values given in A. by 2
C. MOIST soils:
Soils which have drained but not dried out (i.e., field capacity):
divide values from A and B by 3.
Soils close to saturation:
choose value close to min. infiltration rate.
Soils which have partially dried out:
divide values from A and B by 1.5 – 2.5.
GreenAmpt and Modified GreenAmpt
- Suction Head: It represents the average value of soil capillary suction along the wetting front, measured in inches or millimeters.
- Conductivity: This parameter signifies the soil’s saturated hydraulic conductivity, measured in inches per hour (in/hr) or millimeters per hour (mm/hr).
- Initial Deficit: It denotes the fraction of soil volume that is initially dry, which is essentially the difference between the soil’s porosity and its initial moisture content.
The initial deficit value for a fully drained soil can be calculated as the difference between the soil’s porosity and its field capacity. Typical values for these parameters can be found in the Soil Characteristics Table.
- Number: It refers to the SCS (Soil Conservation Service) curve number, which is defined in the publication “SCS Urban Hydrology for Small Watersheds, 2nd Ed., (TR-55), June 1986.” Specific values for curve numbers can be found in the Curve Number Table, categorized by soil group. The Soil Group Table provides definitions for these various soil groups. Adjustments may be necessary when dealing with subcatchments containing separate pervious and impervious fractions, especially when the selected Curve Number is based on a table that combines both land uses.
- Drying Time: It indicates the duration in days required for a fully saturated soil to dry out. Typical values for drying time typically range from 2 to 14 days.
- Conductivity: This property has been deprecated and is no longer utilized in the modeling process.
Copyright © 2025 Smart City Water
—
Powered by 