
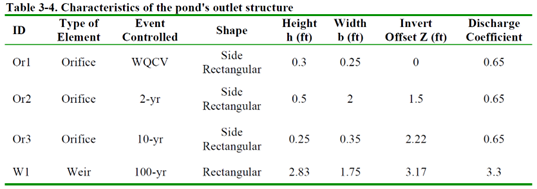
The final VOSWMM model, including the detention pond, is presented in Figure 3-9 with the input file named Example3.inp. Table 3-4 summarizes discharge elements in the pond’s outlet, detailed in Figure 3-10.

Figure 3-9
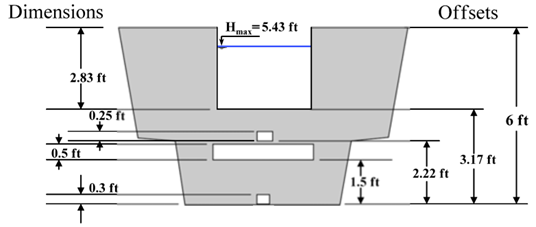
Figure 3-10
To evaluate the detention pond’s performance, outflow hydrographs were compared: post-development controlled (Example3.inp), post-development uncontrolled (Example2-Post.inp), and pre-development (Example1-Pre.inp). Time steps used were 15 seconds for reporting, wet-weather runoff, and flow routing, and 1 hour for dry weather runoff.
Figures 3-11 to 3-13 display the results, showing that the detention pond effectively controlled post-development peak discharges, restoring them to pre-development levels. However, it’s crucial to note that the storage unit didn’t reduce the total post-development runoff volume, which increased significantly due to expanded impervious areas.

Figure 3-11

Figure 3-12

Figure 3-13