
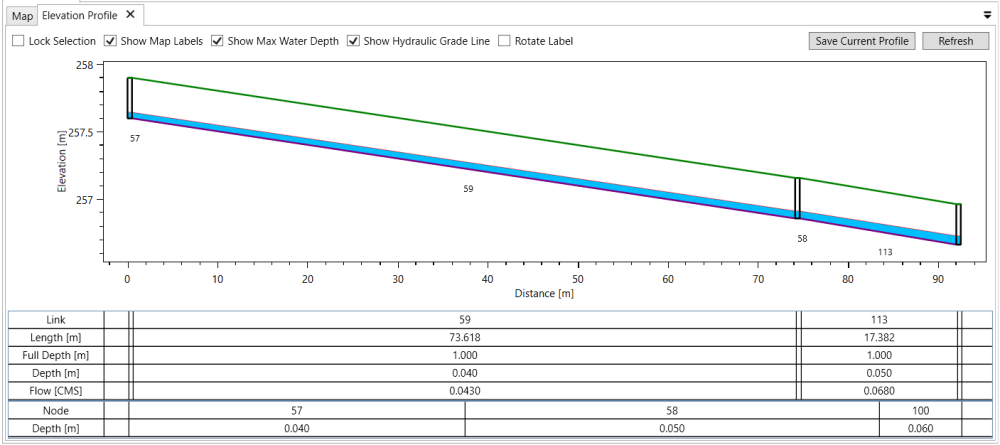
Elevation profile is a tool used to visually plot geo graph of selected Links and Nodes along with their values, such as Length, Max Depth, Depth, and Flow.
There are three ways to plot Elevation Profile.
- Select links on the map and then click the Elevation Profile button. For multiple selection, hold Ctrl key.
- Select the starting node first, select the ending node by holding Ctrl key and then click the Elevation Profile button. With selecting two nodes, VOSWMM will search the possible paths between the starting node and the ending node regardless of the flow direction, and get the path that has the minimum number of links
- Use dedicated selection buttons in the GIS Tools toolbar or selection menu in the context menu on the map to select between, select upstream, select downstream or select long section to select nodes and (or) links. For multiple selection, hold Ctrl key. Then, click the Elevation Profile button.
With selection on Elevation Profile, a new tab will show up with dedicated plots for each links/nodes along with their summary tables showing basic data.
Please note that for the link whose type is pump, orifice, weir and outlet, they will not be shown on the graph and table, because their length is 0.
The following options are available to interact with the graph and summary table:
Checkbox Options
- Lock Selection – unchecked by default. If is unchecked, the profile plotting will be updated with the selections on the map. If you do not update the plotting of elevation profile, check the Lock Selection box.
- Show Map Labels – checked by default. If is unchecked, the NHYD label on the graph will be hidden.
- Show Max Water Depth – checked by default. If is unchecked, the Depth and Flow of Link table and Max Water Depth plot (blue color) will be hidden.
- Show Hydraulic Grade Line – checked by default. If is unchecked, the Hydraulic Grade Line (red color) will be hidden.
- Rotate Label – unchecked by default. If is unchecked, the label will be in horizontal position. If is checked, the label will be in vertical position.
Graph Operations
- Zoom in/out – scroll mouse middle wheel to zoom into the graph with mouse focus area
- Zoom by area – press and hold mouse middle wheel and draw a rectangle on the graph area to zoom
- Reset zooms – double click on mouse middle wheel to reset all zooms
- Show tracker point – press and hold left mouse button along the graph to see the tracker/data point
- Copy to Clipboard – click on graph and press Ctrl + C to copy the graph to Clipboard
Graph Context Menu
Right click on the graph to open the context menu:
- Undo All Zoom/Pan – undo all zoom and pan and reset the graph and table as the initial display
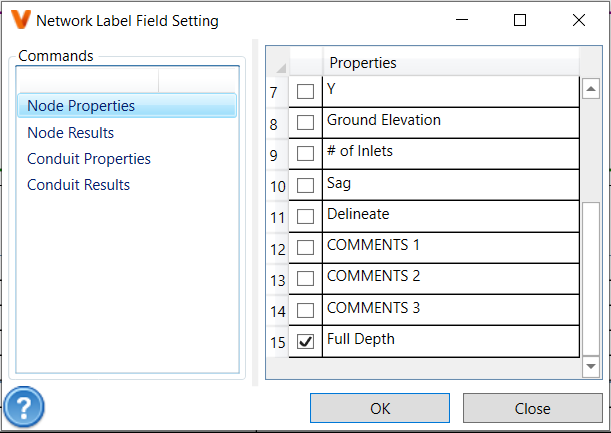
- Field Setting – pop up a window to let users add parameters and variables to or hide them on the Summary Tables below the elevation profile graph
![]()
- Save Image As – save image as supported photo format
- Print – print graph
- Copy (Ctrl + C) – copy the graph to Clipboard
Summary Tables
- Below the graph are summary tables for the links and nodes that are plotted on the profile graph. The columns of the tables are aligned with the positions of links and nodes on the elevation profile graph. The following parameters and variables are shown for node and link tables:
- Link table
- Link – the NHYD of the link
- Length – the length of the link (i.e., conduit)
- Full Depth – the full depth of the link
- Depth – the max water depth from the time-series simulation
- Flow – the max flow from the time-series simulation
- Node table
- Node – the NHYD of the node
- Depth – the max water depth from the time-series simulation
- Link table
- Select Link / Node by their NYHD to zoom/highlight corresponding plot on the graph. The selected Link / Node will show on Properties window, and the changes made to those values showing on summary table via the window will be updated on the graph and summary tables as well.
Save Elevation Profile into Project Manager
- Click Save Current Profile button, and then enter a unique name to save the profile into Project Manager. The saved profile will be showing up under the Elevation Profiles group of Project Manager window. Double-click on the saved profile in the Project Manager will open the saved elevation profile with graph and summary tables.
Copyright © 2025 Smart City Water
—
Powered by 