
SWMM can simulate storage units capturing runoff from various design storms and releasing it systematically to a receiving channel. This example illustrates the iterative process of designing a storage pond, altering its dimensions and outlets to meet criteria for design storms. The main steps include:
- Estimating Water Quality Capture Volume (WQCV).
- Sizing Storage and Outlet for WQCV Release Control.
- Sizing Storage and Outlet for Peak Runoff Control in 2-, 10-, and 100-year storms.
The ultimate design comprises a site-specific storage unit with shape tailored to location, rainfall, and climate. It integrates surface area and storage depth and a multi-outlet structure for diverse runoff. Figure 3-2 displays a pond schematic with outlets for WQCV and peak discharge control, using a trapezoidal prism shape for major (10- and 100-year) and minor (WQCV and 2-year) storms.

Figure 3-2
Source: “Storm Water Management Model Applications Manual”
Significantly, runoff regulation involves a mix of orifices and weirs rather than a single outlet. Orifice 1 oversees WQCV release, Orifices 1 and 2 manage the 2-year storm, Orifices 1, 2, and 3 control the 10-year storm, and all orifices combined with Weir 4 regulate the 100-year storm release.
Estimation of the Water Quality Capture Volume
The Water Quality Capture Volume (WQCV) is pivotal for stormwater quality enhancement facility design. Ideally, calibrated long-term runoff simulations inform this volume, but simpler estimations exist when extended records are lacking. The UDFCD’s (2001) methodology, as depicted in Figure 3-3, is employed in this instance. It gauges WQCV based on total catchment imperviousness and capture volume drain time. The process to estimate WQCV for the designed detention basin is as follows:

Figure 3-3
Source: “Storm Water Management Model Applications Manual”
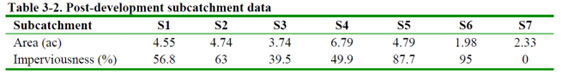
- Calculate Directly Connected Impervious Area (DCIA) by excluding non-draining areas like rooftops and patios. These values are tabulated for the seven subcatchments (from Example 1) in Table 3-2.
![]()
- Determine the average percent imperviousness by weighting subcatchment imperviousness by area and dividing by the total area (28.94 acres). This yields 57.1%.
- Compute WQCV in watershed inches. Assuming a 40-hour drain time for a Colorado high plains site, the WQCV from Figure 3-3 is 0.23 inches. Hence, the total control volume is 0.555 acre-ft or 24,162 ft³.
- If the design site differ from Colorado’s high plains near the foothills, adapting the WQCV derived from Figure 3-3 becomes necessary. These curves, designed for the 80th percentile runoff event, suit foothill regions. However, for other locations, the WQCV from Figure 3-3 can be altered for an appropriate volume, WQCVo, employing Equation 3-1. This equation employs d6, representing the average precipitation depth of runoff-inducing storms, designated for a 6-hour inter-event interval with a minimum depth of 0.1 inches. Figure 3-4 illustrates d6 estimations for the contiguous United States (UDFCD, 2001).
WQCVo = d6 (WQCV/0.43)
Pond Geometry and Dimensions
The storage unit shape relies on local regulations at the construction site. Generally, it’s advisable to optimize the distance between inlet and outlet, with a length-to-width ratio of 2:1 to 3:1 being suitable. In this case, a 2:1 length-to-width ratio, a WQCV depth (h1) of 1.5 feet, and a side slope of 4:1 (H:V) will be employed. Figure 3-4 illustrates the WQCV geometry, offering equations established on the 2:1 length-to-width ratio and 4:1 side slope, defining the unit’s structure. The following steps detail the determination of WQCV dimensions.
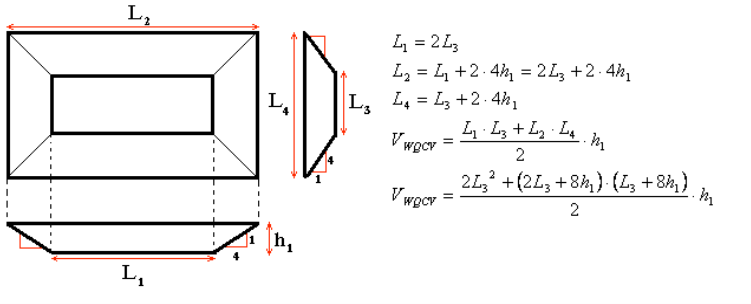
Figure 3-4
Source: “Storm Water Management Model Applications Manual”
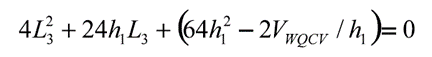
- Calculate L3 using the derived WQCV (24,162 ft3) and h1, set to the WQCV depth (1.5 ft). Rearranging the fifth equation from Figure 3-4 forms a quadratic equation for L3: Solving results in L3 = 85.15 ft ≈ 86 ft.
![]()
- Determine remaining WQCV dimensions using L3 and h1. Applying the first equation from Figure 3-4, L1 equals 170.3 ft ≈ 171 ft, L2 is 184 ft as per the second equation, and L4 is 98 ft per the third equation.
- Specify the storage curve for the WQCV segment within the storage unit. At 0 depth, the area is L1·L3 = 14,706 ft², while at full 1.5 ft depth, it becomes L2·L4 = 18,032 ft². These points will be input in the following section alongside new points to align with the shape in Figure 3-2 for enhanced volume control.
Adding a Storage Unit to the Model
The Example2-Post.inp file serves as a starting point to incorporate a storage unit into the model, representing the detention pond. These steps outline the storage unit definition:
1. Create a new Storage Curve object, SU1, to emulate the storage unit shape.
2. Input the two established depth-area points into Curve Editor dialog for curve SU1: d1 = 0, A1 = 14706 ft² and d2 = 1.5 ft, A2 = 18032 ft².

Figure 3-5
3. Integrate a new storage unit node (SU1) onto the map (Figure 3-6), unconnected to the drainage system. Key properties for SU1 include: Storage Curve = Tabular; Curve Name = SU1; Invert Elevation = 4956 ft (six feet lower than the outfall node elevation in prior examples); Maximum Depth and Initial Depth = 1.5 ft (controlling WQCV).

Figure 3-6
4. Add an extra node (J_out), conduit (C_out), and outfall node (O2) connecting the orifices and weirs from storage unit (SU1) to outfall node (O2). This compensates for SWMM’s limitation on linking multiple hydraulic links to an outfall node. J_out and O2’s invert elevations are set at 4954 ft to avert backwater effects; C_out has length 100 ft and roughness 0.01. Figure 3-7 showcases the independent storage unit system, tabular storage curve SU1 for WQCV, and storage unit’s Properties table. Initially, the storage unit and its WQCV orifice function separately from the watershed to size the orifice for a 40-hour drainage period. Despite appearing together in the same input file (Figure 3-6), they operate independently in the model due to a lack of hydraulic connection. The pond’s position in Figure 3-6 stands as its final location in the model. While the park area could accommodate the pond, it’s placed downstream for clarity.

Figure 3-7
Sizing the WQCV Orifice
The next step involves designing the pond outlet to release the entire Water Quality Control Volume (WQCV) within 40 hours. This outlet, connecting the storage unit to downstream outfall O2, can be located at the unit’s bottom or side, in circular or rectangular shape. To size the orifice for 40-hour WQCV drainage, follow these steps:
1. Add a rectangular side orifice (Or1) between storage unit SU1 and node J_out leading to the outfall. Set its inlet offset to zero for alignment with the storage unit, and assume a default discharge coefficient of 0.65.
2. Configure simulation time steps: set reporting, wet-weather, and routing time steps to 15 seconds and dry-weather time steps to 1 hour. Extend simulation duration beyond 40 hours for proper evaluation; here, we use 72 hours.


3. Determine Orifice Or1’s final dimensions by iteratively running SWMM with Dynamic Wave flow routing, adjusting the orifice until it achieves a 40-hour WQCV drainage. In each run, vary orifice dimensions while keeping the storage unit’s initial water depth at 1.5 ft. Note, runoff discharge from subcatchment rainfall doesn’t affect the storage unit in this phase as it’s not connected to the drainage system.

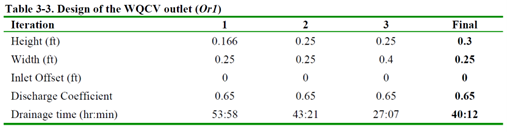
Figure 3-8 displays drainage times for multiple iterations, along with the final design. Table 3-3 lists dimensions assigned to the orifice during each iteration. The final orifice, typical of a WQCV orifice, has a 0.3 ft height and 0.25 ft width, requiring protection with screens to prevent blockage during storms. Regular maintenance ensures the screens remain debris-free.

Sizing the 2-yr Design Storm Orifice
The runoff volume generated by the 2-year storm surpasses the capacity designed for in the prior section, necessitating an enlargement of the storage unit and the creation of a new outlet. This new outlet, situated 1.5 feet above the basin floor, triggers when runoff exceeds the WQCV, regulating not only the peak runoff rate of the 2-year storm but also partially managing larger storms. To achieve the required increase in storage volume, the sides of the storage unit are extended above the WQCV depth while maintaining a 4:1 (horizontal to vertical) lateral slope, as depicted in Figure 3-2. Here’s a concise breakdown of the steps to size the storage unit for the 2-year design storm orifice:
1. Connect the storage unit to the drainage system: Begin by redirecting culvert C11’s outlet to channel flow into SU1 while eliminating the original outfall node O1. With a downstream offset of 1 foot, culvert C11 operates without backwater issues during minor storms, ensuring its crown remains below the storage pond’s top.
2. Expand the pond for flood control: Increase the pond’s height while maintaining a constant slope, as shown in Figure 3-2. Achieve this by introducing new surface area-depth pairs into the storage curve SU1. Set the initial depth to zero and the maximum depth to 6 feet to accommodate the additional volume.
3. Model the 2-year storm: Run the model for the 2-year storm using solely the WQCV orifice to determine essential parameters. This reveals a maximum storage unit depth of 2.82 feet, a peak orifice discharge of 0.64 cubic feet per second (cfs), and an emptying time of 56 hours and 23 minutes.
4. Enhance the 2-year storm pond outflow: Given that the pre-development 2-year peak runoff (4.14 cfs as per Table 3-1) exceeds the discharge capacity of the WQCV orifice (0.64 cfs), it’s advantageous to boost the 2-year storm pond outflow. To achieve this, introduce a second orifice (Or2) directly above the WQCV depth (with an inlet offset of 1.5 feet), as depicted in Figure 3-2. Configure Orifice Or2 with a rectangular shape, an inlet offset of 1.5 feet, and a discharge coefficient of 0.65. Ensure it’s visually distinct from the existing orifice Or1 on the map.
5. Estimate Or2’s initial area (A): Calculate an initial estimate of Or2’s area (A) using the orifice equation.
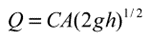
With a coefficient C = 0.65, a target discharge (Q) of 3.5 cfs (resulting from the subtraction of 0.64 cfs from 4.14 cfs), and a head (h) of 1.34 feet, this yields an orifice area of 0.58 square feet. Assume an initial height of 0.58 feet and a width of 1 foot for Or2.
6. Iterate to size Or2: Initially, with these dimensions, running the model produces a discharge of 2.84 cfs, falling short of the target (4.14 cfs). Therefore, iterative adjustments are necessary, maintaining Or2’s height at 0.5 feet and incrementally varying its width until the combined discharge of both orifices closely approaches 4.14 cfs. Ultimately, a size of 0.5 by 2 feet yields a peak discharge of 4.11 cfs and a maximum storage unit depth of 2.21 feet.
7. To simplify Or2 sizing, its height remains fixed at 0.5 feet. We vary its width in 0.05-foot increments until both orifices’ combined discharge nears 4.14 cfs. Ultimately, a size of 0.5 by 2 feet achieves a peak discharge of 4.11 cfs and a maximum storage depth of 2.21 feet, making these dimensions ideal for the 2-year orifice.
Note:
In VOSWMM, you can use polylines to draw links made up of multiple straight-line segments that define their alignment. You have the flexibility to add, delete, or move points within these links. This feature is particularly handy when multiple links share the same end nodes and need to be distinct on the map, as seen in the figure where polylines distinguish various orifices and weirs in a storage unit’s outlet structure.

Sizing the 10-yr Design Storm Orifice
So far, we’ve represented the storage unit as a trapezoidal prism, initially designed for the Water Quality Control Volume (WQCV) and expanded to handle 2-year storm runoff. Now, we’re reshaping it to include an extra trapezoidal prism above the minor storm prism, accommodating 10- and 100-year storm volumes (see Figure 3-2). Here’s how we size the 10-year storm orifice:
1. Modify storage curve SU1: Adjust SU1 by replacing surface area-depth pairs d2,A2 and d3,A3 with three new pairs: d2 = 2.22 ft, A2 = 19659 ft²; d3 = 2.3 ft, A3 = 39317 ft², and d4 = 6 ft, A = 2452644 ft². Notably, d2 marks the 2-year storm’s peak height. Point 3’s area doubles that of point 2, with d3 set 0.1 feet above d2 for a gradual transition. In practice, this transition area would slope at 2% for post-storm drainage. Point 4’s area is computed by extending the unit’s sides above point 3, keeping a 4:1 lateral slope.
2. Model the 10-year storm: Run the model using the 10-year storm and existing orifices to check if a new one is needed. The max water depth is 3.20 ft, with a combined peak discharge of 6.96 cfs from existing outlets. The pre-development 10-year peak discharge is 7.34 cfs, suggesting we can reduce the storage unit volume by adding another orifice.
3. Add a new 10-year storm orifice (Or3): Introduce Or3 above the 2-year storm control depth (inlet offset = 2.22 ft). Like Or2, Or3 includes intermediate vertices for clarity. Using the orifice equation (C = 0.65, Q = 0.38 cfs, h = 0.98 ft), we estimate an orifice area of 0.073 ft², with an initial size of 0.25 ft in height and width.
4. Refine Or3: After modeling the 10-year storm with this initial Or3 size, the combined discharge reaches 7.22 cfs, just shy of the pre-development discharge (7.34 cfs). To align with the target, we increase Or3’s width to 0.35 ft and re-run the model. The new combined discharge is 7.32 cfs, and the max storage depth is 3.17 ft. These dimensions suit the 10-year orifice (height = 0.25 ft, width = 0.35 ft).
Designing the 100-yr Weir
We proceed by running the model for the 100-year storm, utilizing the combined WQCV, 2-year, and 10-year orifices to assess the need for a 100-year weir. The combined peak discharge from these orifices during the 100-year storm is 12.57 cfs, insufficient to handle the 100-year storm runoff of 31.6 cfs, leading to storage unit flooding. To address this:
1. A new weir link, W1, is introduced, connecting the storage unit to the final outfall node. It’s designed as a transverse weir with an inlet offset of 3.17 feet above the storage unit bottom and a discharge coefficient of 3.3. The weir’s opening height matches the distance between the 10-year storm runoff control level and the storage unit’s maximum depth. The weir’s height is fixed at 2.83 feet, aligning with the space between the 10-year storm runoff control and the storage unit’s peak depth.
2. We calculate an initial weir width, approximately 3.45 feet, using the weir equation (C = 3.3, Q = 19.03 cfs, h = 2.83 ft).

3. Running the model for the 100-year storm with the defined weir dimensions yields a peak total discharge of 42.4 cfs, exceeding the target of 31.6 cfs.
4. We iterate by testing smaller weir widths until achieving a combined discharge close to 31.6 cfs. A width of 1.75 feet accomplishes this with a combined 100-year discharge of 31.2 cfs and a maximum storage unit depth of 5.42 feet.
5. Lastly, we confirm that sufficient freeboard exists; it currently provides 0.53 feet. The specific requirement depends on local guidelines, such as the UDFCD (2001), which mandates a 1-foot freeboard above the maximum water surface elevation during maximum weir discharge.