
We enhance runoff controls on the study site starting from the Example6-Initial.inp file. This file already includes the local LIDs from Example 4 and the modified storage unit and outlet structures from problem statement. Land uses in this file were adjusted based on the discretization used in Example 4. TSS washoff follows the EMC washoff function from Example 5. Curb lengths and land uses for each subcatchment can be found in Table 6-3, with subcatchments treated by infiltration trenches or filter strips highlighted in grey.

LID Treatment
We assume each filter strip and infiltration trench can remove 70% of TSS from runoff, a common rate for such LIDs. We create a new land use called “LID” with no TSS buildup, an EMC TSS washoff function at 0 mg/L, and a 70% TSS removal efficiency. We assign this land use to all LID subcatchments (S_FS_1 to S_FS_4 and S_IT_1 to S_IT_4) at 100%, ensuring a 70% reduction in TSS for runoff from upstream subcatchments flowing over them.
Detention Pond Treatment
We use the following equation:
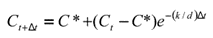
to simulate TSS removal in the detention pond. To achieve a desired 95% reduction in TSS within a 40-hour detention period for the 0.23-inch WQCV design storm, we estimate the value of the removal constant ‘k’ like this:
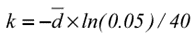
Where ‘d’ is a representative pond depth during the 40-hour release period. It can be later confirmed that the average depth for the 0.23-inch design storm over 40 hours is 0.15 feet. Using this value in the ‘k’ expression yields an estimate of 0.01 feet per hour. This is in line with the 0.03 feet per hour figure mentioned in the US EPA (1986) report, representing the 20th percentile of settling velocity distributions observed in 50 runoff samples from seven urban sites in the EPA’s Nationwide Urban Runoff Program (NURP).
Using this ‘k’ value and assuming a minimum remaining TSS concentration (‘C*’) of 20 mg/L, we input the following expression into VOSWMM’s Treatment Editor for storage unit SU2:
C = 20 + (TSS – 20) * EXP
Here’s what each term means in relation to Equation: ‘20’ represents the assumed ‘C*’ value, ‘TSS’ is the label for TSS concentration (‘C’) in this model, ’0.01/3600’ is the ‘k’ value in ft/s, ‘DEPTH’ is VOSWMM’s term for water depth (‘d’) in feet, and ‘DT’ is VOSWMM’s term for routing time step (‘t’) in seconds. SWMM automatically substitutes the current values of ‘DEPTH’ and ‘DT’ into the expression at each time step when it encounters these reserved words.
For all simulations using this treatment-enhanced input file, these analysis options should be selected:
| Flow Routing Method | Dynamic Wave |
| Wet Weather Time Step | 1 minute |
| Flow Routing Time Step | 15 sec |
| Reporting Time Step | 1 minute |
| Total Duration | 2 days (48 hr) |
A 48-hour duration was chosen to fully observe the WQCV drawdown in the detention pond. It’s also advised to increase the number of decimals from the default 2 to 4. You can do this in VOSWMM by navigating to Home > Options > General. This adjustment helps maintain accuracy when exporting results from VOSWMM to a spreadsheet for comparison, especially when variations are small. The resulting input file is named Example6-Final.inp.