
Hydrographs
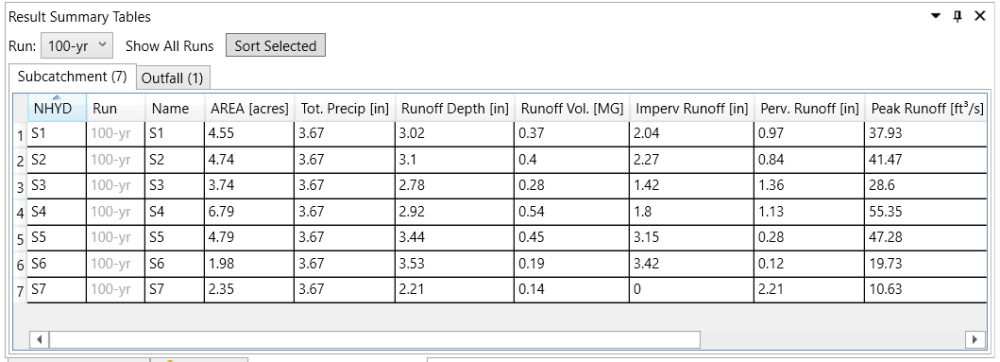
We can view the summary results in the Result Summary Tables in the same fashion as for the pre-development condition. Click the header of NHYD to sort the table by subcatchment NHYD.
Pre- and Post-Development Comparison
To compare hydrographs of pre- and post-development, select the outfall node and then click the Scenario Comparison button in the Simulation toolbar. In the pop-up window, select the Run to be compared and choose Total Inflow in the Variables.

Unlike the pre-development case, the post-development hydrographs show a more rapid decline once the rainfall ceases. This behavior can be attributed to the much larger amount of imperviousness under the post-development condition (57%) as compared to pre-development (5%).
Copyright © 2025 Smart City Water
—
Powered by 