
For more information about the tools and its analyzed indices, please refer to Manhole Inflow Analysis.
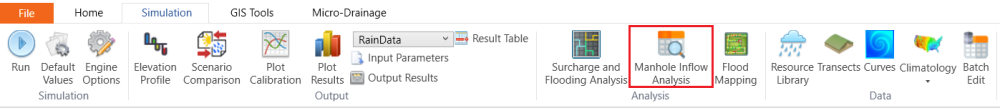
Navigate to Simulation toolbar and click the Manhole Inflow Analysis button.
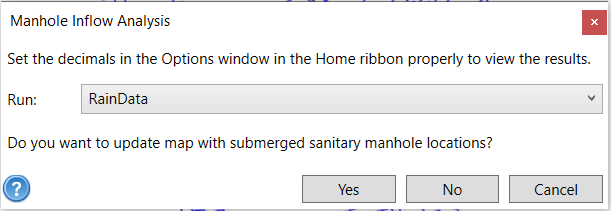
In the pop-up Manhole Inflow Analysis window, select the Run and click Yes to update the map automatically with manhole analysis results.
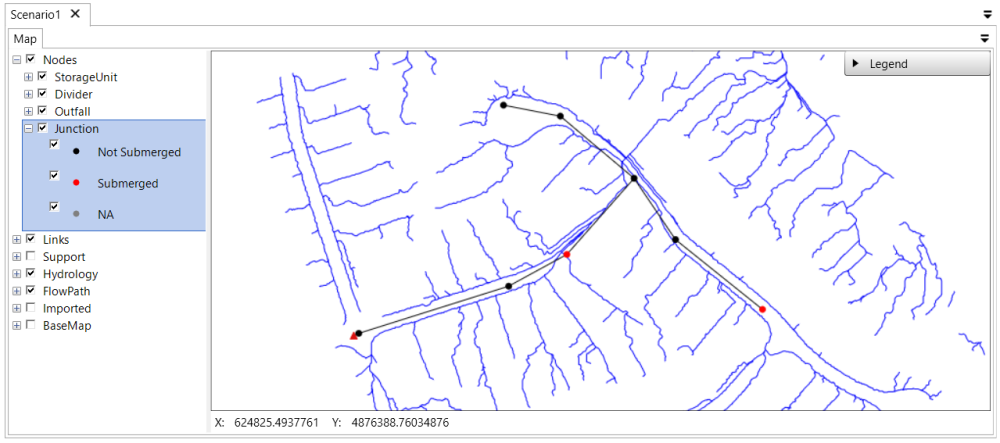
After the analysis is done, the map will be updated as below. Expand the map layer tree Nodes -> Junction. We can see that the symbology meanings of the Junctions.
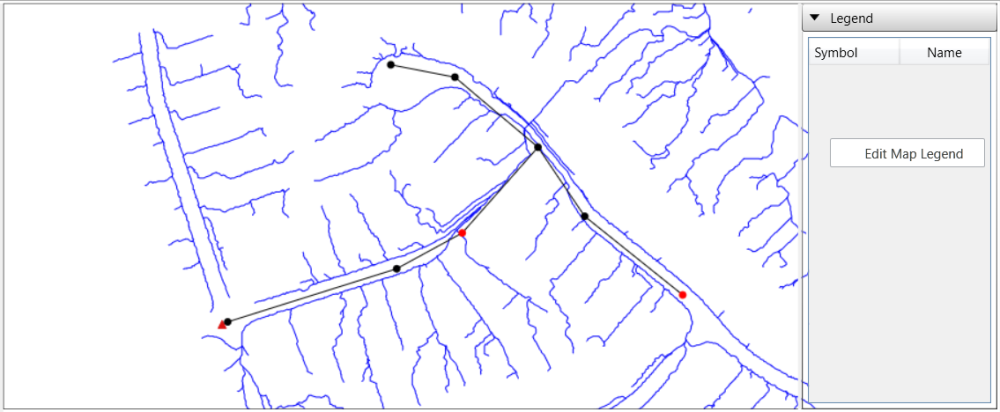
Users can also add the symbology to the Legend. To do that, expand the Legend section at the right upper corner of the map. Right click on that section. A context menu Edit Map Legend will display.
In the pop-up Map Legend window, select Junction in the left panel and click the  button to add it to the right panel. Then, click OK and close the Map Legend window.

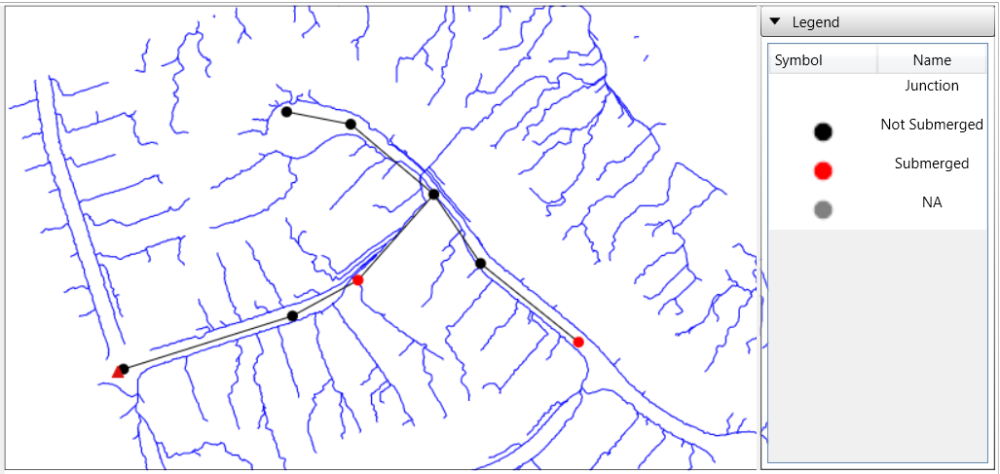
The map legend will be updated.
The manhole II analysis results are also summarized in the Result Summary Tables. Click on the Junction tab and sort the table by the Submerged by clicking on the Submerged header. Click the header twice to sort the submerged manhole on the top of the table,
