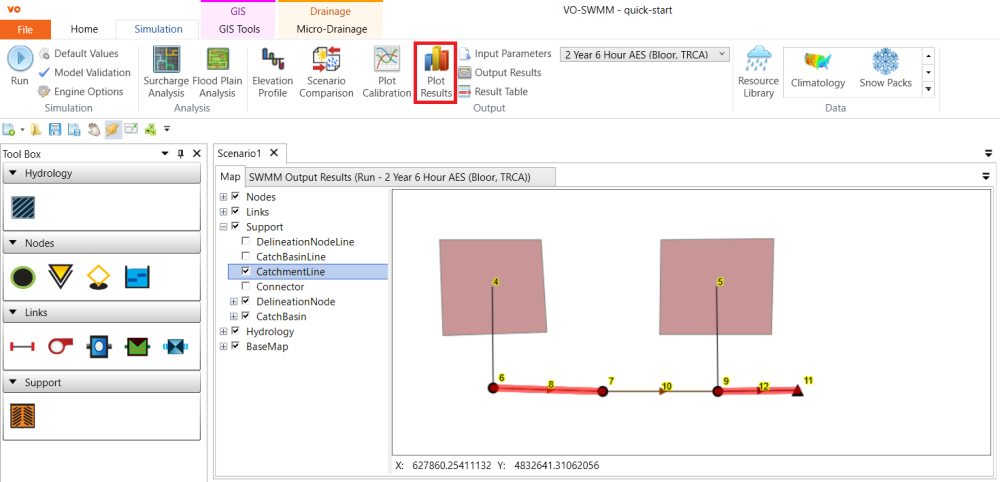
Select objects on the map canvas, for example, the Conduit NHYD 8 and 12. Make sure you choose the simulation run in the drop-down list in the Output section under the Simulation tab. Then, click Plot Results under the Simulation tab.
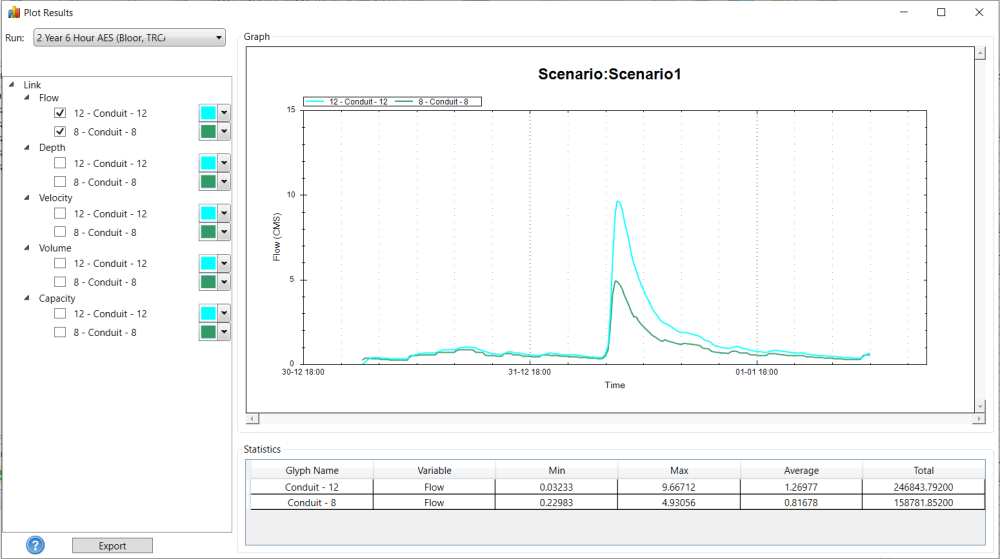
The Plot Result window displays the Graph of time-series plotting of the selected objects. The Statistics table is shown below the Graph. Click the Export button to export time-series results in CSV files.
Note: the result shown below is for demonstration purpose. Your results can be slightly different from the figure below.
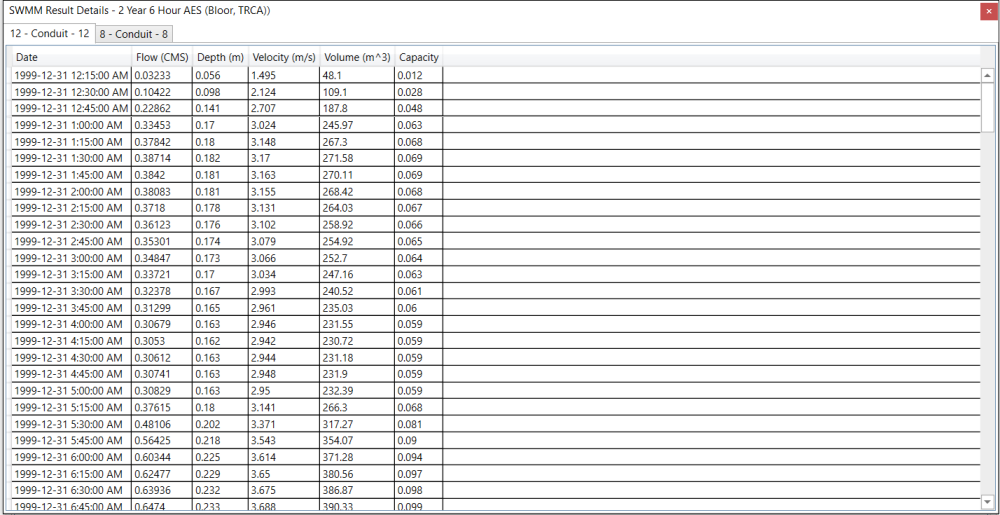
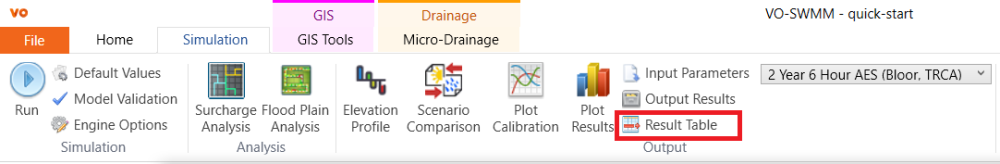
Close the Plot Result window. Click the Result Table under the Simulation tab.
The table of time-series results for selected objects will show. Sort the table by clicking the column header.