Before any paper (or PDF) reports can be generated from Moving Light Assistant, we need to define what information we want the report to show, and how we want that information laid out. This information is held in layout files. Before any report can be generated, an appropriate layout file must first be loaded. Moving Light Assistant comes with several layout files which may be loaded to provide some basic reports, and a powerful graphical ‘Report Designer’ which allows you to design your own custom report layouts.
At first sight, the lack of any inbuilt reporting ability may seem a drawback, and the process of building and loading custom layouts, laborious and cumbersome. However once the process is understood and one is familiar with the function of the ‘Report Designer’, the power and versatility of the system becomes apparent. It is worth pointing out that a report design will typically only have to be undertaken once, after which the same layout file can be used with different show files over and over again.
In this tutorial we will look at producing a layout file for a simple instrument schedule containing the following information: Unit# / Position / channel / DMX address / Fixture type
Open the Report Designer
- From the main menu bar, select
Reports, thenReport Designer.... The ‘Report Designer window’ will open.

- Select the New Report icon, or
File->New Reportfrom the menu bar.
The ‘New Report’ settings window will open. There are only two mandatory fields to fill in at this stage (Bold Headings):
Title
Enter a title of your choice for the report. In this example, enter Inst. Schedule.
Internal name
This field is a pointer to the type of information the report will contain. The field must contain one of the following phrases, exactly as typed here:
- Rig Data
- Cue List
- Wheel Load
- Channel Usage
- Preset Doc
- Cue Moves
The names are pretty self descriptive. As we are creating an Instrument Schedule in this tutorial, we need to use Rig Data.
Other fields are available if you wish to enter further information, but their use is not compulsory.
These settings can always be re-visited by clicking on the Report Preferences icon, but for the moment, click OK to close the window and move on.

Upon closing the settings window you will be presented with the ‘Report Designer’ main layout window. Initially this represents a blank sheet of paper, as we have not yet told the layout designer what information we want to display, and whereabouts on the page we wish to display it. Down the right-hand side of the screen, under the title ‘Properties’ is information about the paper size, orientation and border size. All this information can be changed by clicking back on Report Preferences.
It is important to realise that the ‘Report Designer’ is a graphical layout tool, and the paper space being presented in front of you is a blank canvas on which on which information can be placed anywhere, in any order, in any colour and any font. It may be interspersed and combined with simple graphical shapes and imported pictures.
Because we are working in a graphical environment, and are not limited to simple multiple rows of text, there is a grid to assist you in laying out and aligning your information. The grid size and its visibility are controlled by buttons along the bottom of the screen. The grid represents the printable area of the paper space, and does not include the margins. As various items are added to the page, their positions will ‘snap’ to the grid, ensuring easy uniform alignment.
Adding Data
Click on the button labelled T on the left-hand side of the screen and click anywhere on the paper space to place a text block. Repeat the process four more times. Each text block will eventually represent a piece of rig data, in this example, unit number, position, channel, fixture type and DMX address. Remember you can place the text blocks anywhere you wish on the paper, but because we are producing a simple instrument schedule where we probably want the information displayed in rows, place the text blocks one after the other in a single row.

Each text block is a ‘place holder’ for the real data, and we now need to link each placeholder with the appropriate piece of data.
- Double click on the first place holder and type
[UnitNumber]into the pop-up text edit window.
- Click OK to close the window.

Alternatively, edit the text in the text edit window to the right-hand side of the screen.

- Repeat the process for the other four place holders, entering the data types [Position], [Channel], [FixtureType], [DMXAddress], in the order in which you wish the information to be displayed.
- Finally, because there are multiple fixtures in our rig data, we need to tell Moving Light Assistant to create a new row of information for every new set of data it finds. To do this we need to append
Row_to the internal names.
- Select the first text block, which in our example is now displayed as [UnitNumber]. On the right-hand side of the screen, under the heading ‘Property’ you will find its ‘Internal name’, ‘Text1’. The internal names are automatically derived from the order in which the text block was originally placed on the paper.
- Edit the internal name to ‘Row_UnitNumber’. The internal name can be anything you want so long as it is unique, and in this instance, preceded by ‘Row_’

- Continue the process for the other four text blocks.
We should now have the basis of a ‘rough and ready’ instrument schedule layout.
- Click on the Save icon to save this layout. Ensure the layout is saved to the default ‘Report Layout Templates’ folder in the Moving Light Assistant installation folder.
- Click on the Close Designer icon, or use
File > Close designerto exit the ‘Report Designer’.
Testing the Report Layout
Having designed your report layout, it is now time to produce an instrument schedule from real rig data.
- Open the show file in Moving Light Assistant from which you wish to produce the report, and click on the Report Preview tab. The empty report preview window will open.

- Select your report layout file from the drop-down list of reports, and accept the rig data report default options. (Sort by position, Show All).
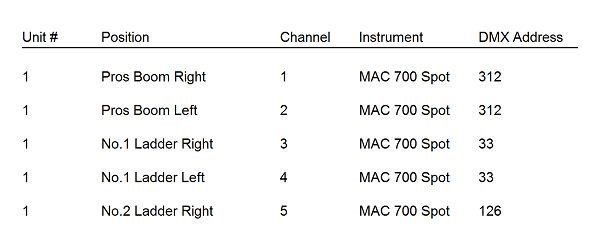
If all is well, your report should now be generated based upon your layout.

Once you are happy with the layout of your basic Instrument schedule, it is a simple matter to either print to paper, or print directly to PDF by clicking on the appropriate icons.
A common error is shown below. In this case, a text block has been assigned an invalid data name, [DMXAdd], rather than the correct [DMXAddress]. This must be corrected by editing the layout file in ‘Report Designer’.

Although we now have the beginnings of an instrument schedule, there is still a lot we can do to tidy it up. In particular, two missing features are column headings and titles.
Adding Column Headings and Titles
- Re-open the layout file in the ‘Report Designer’.
To get Moving Light Assistant to produce multiple rows, one for each fixture, we have already prefixed the internal name with ‘Row_’. There are three other prefixes that may be used. RowHeader_, Header_, and FirstPageHeader. Any text with an internal name prefixed with RowHeader_ will appear on every page of the report. Similarly, any text with an internal name prefixed with Header_ will appear only on the first page of the report. Any text prefixed with FirstPageHeader_ will only appear on the first page.
- Place five more text blocks above the existing five text blocks.
- Rename each block with whatever name you want the column heading to be called. In this case, do not use the square brackets as the text you are entering is purely text, and does not relate to any particular data. Similarly, the text does not necessarily have to be the same as the data placeholder. In the example below the data placeholder ‘FixtureType’ is under the heading ‘Instrument’.
- Add a line underneath the headings and drag it out to the full width of the page. This will be given the internal name of ‘Line 1’. Edit this to
RowHeader_Line 1to ensure the line appears on every page.
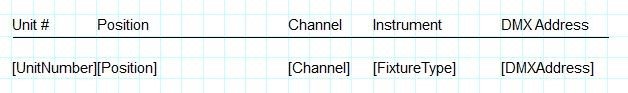
This new layout produces the following report layout:
To add a fixed title on the first page only, simply add the text in to the layout, with an internal name preceded by Header_. For example, to add the title ‘Instrument Schedule’, edit the layout file as below:
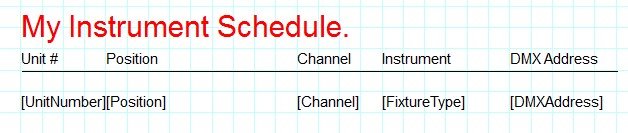
In this example, the text ‘My Instrument Schedule’ is inserted as a text block, with the colour changed to red, and the text size increased. Its internal name has been edited to ‘Header_Big Title’.
As the phrase ‘My Instrument Schedule’ has been inserted as text (without the square brackets), it will never change and will always be there every time this layout file is used. There is, however, much information which may belong in the title which we want to change from production to production.
This information may include any data held by Moving Light Assistant in File->Show->Production. This information includes such things as show title and venue, Lighting Designer’s name, date of opening night etc. All this information can be included by using more data place holders, just as we used data place holders to add rig data.
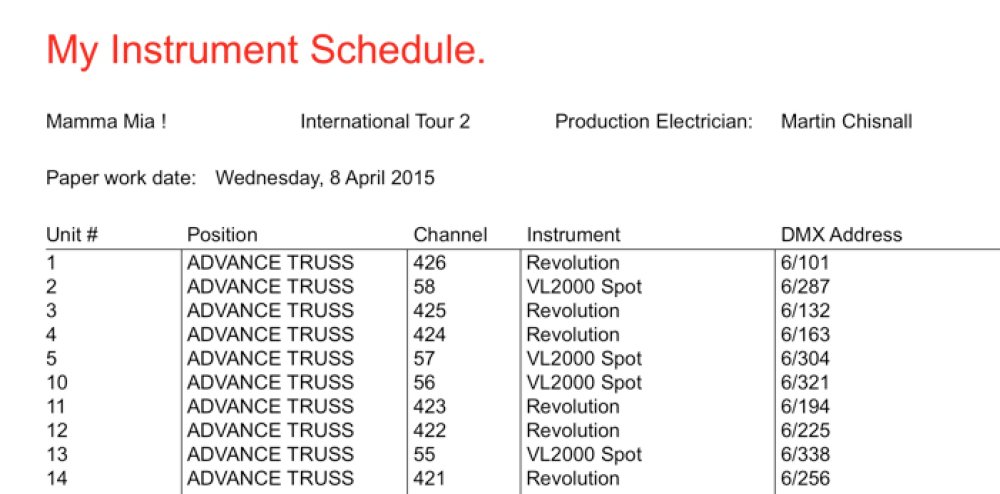
In the example layout file below, the four new data place holders all have internal names prefixed with Header_, and display the name of the production, venue and Production Electrician, along with the date the paperwork was produced. The text ‘Production Electrician’ and ‘Paper work date’ is raw text entered as text blocks to form ‘sub-titles’.
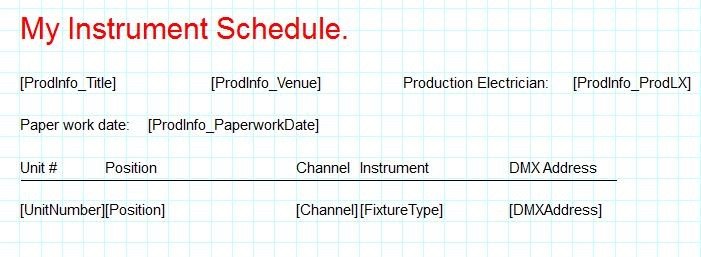
The above layout file produces the following report layout: