
Measurements > Color By Measurements
Colors the separate features in the Current Image according to a set of feature measurements.
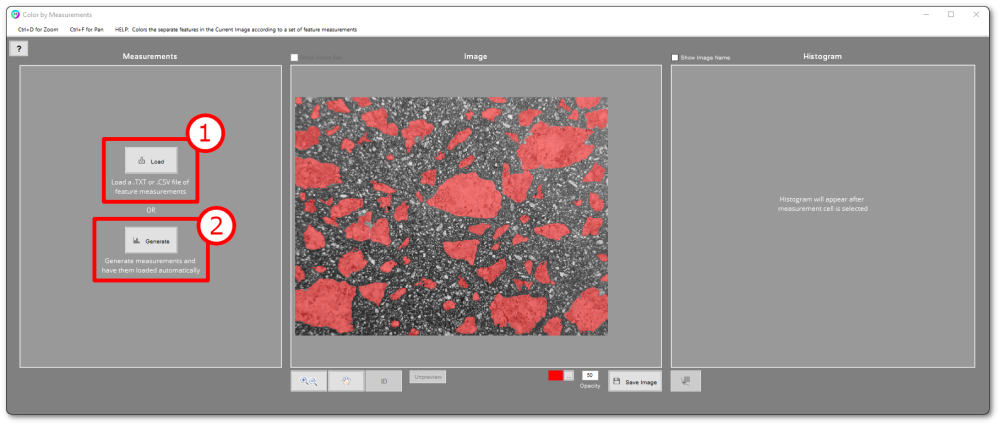
1. Load
- If you have already generated measurements beforehand and then decide to produce a color-coded image, you can load the measurements file here.
2. Generate
- If you have not yet generated measurements, you can generate measurements here to produce a color-coded image. Then, the following window will appear where you can select your desired feature measurements for your color-coded image. Refer to Feature Measurements page for further description on each feature measurement.
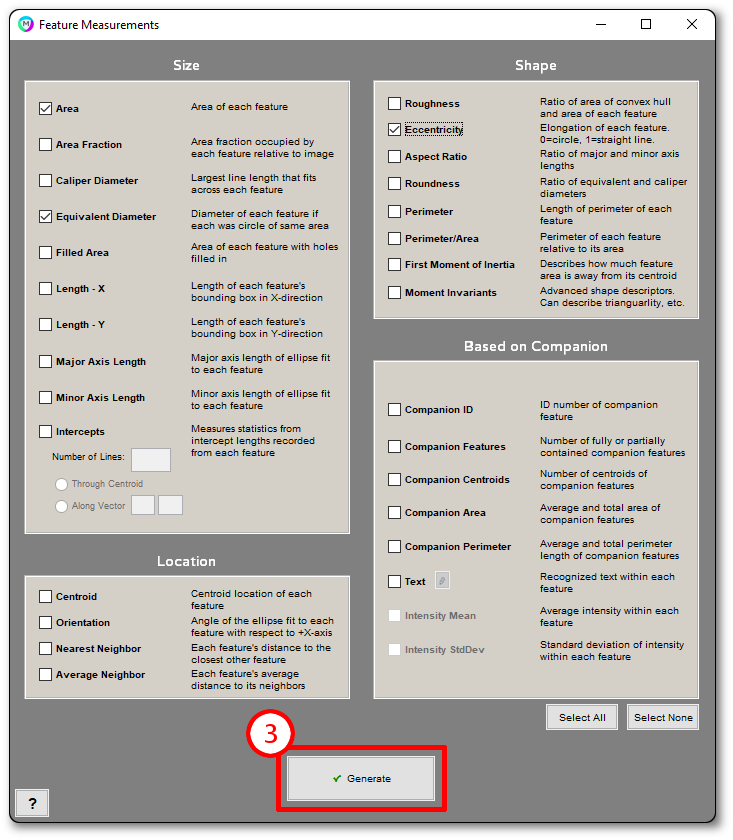
3. Generate
Perform the selected measurements and return to the Color by Measure window.
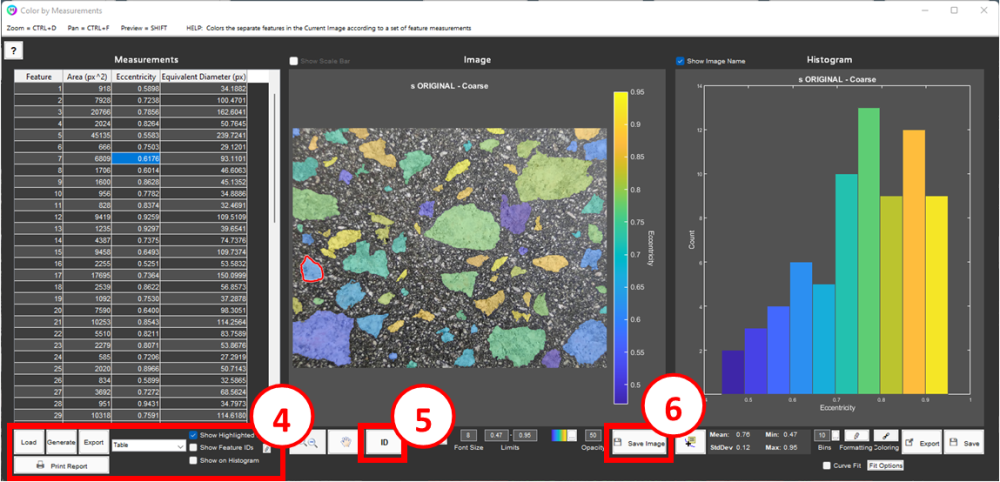
4. Load, Generate, Export
- Load: You can start over and create a new color-coded image by loading a new feature measurements file.
- Generate: You can create a new color-coded image by selecting new feature measurements.
- Export: You can export the existing feature measurements results to a spreadsheet, or to local measurements using a sliding window.
- Show Highlighted Feature: Outlines the feature corresponding to the highlighted cell.
- Show on Histogram: Places a marker on the histogram for the highlighted cell.
- Show Feature Overlay: Places the feature information over each feature. Select the Edit button (pencil) to change contents, style and position.
- Show Feature Overlay Settings: (Wrench button) configure overlay settings.
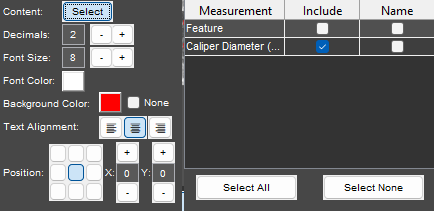
- Content: Select to display the Feature ID number as well as desired measurements. See Include and Name.
- Decimals: Specify the number of digits after the decimal point to include in the overlay.
- Font Size: Specify the font size of the overlay.
- Font Color: Specify the font color of the overlay.
- Background Color: Specify the background color of the overlay or select ‘None’ for a transparent background.
- Text Alignment: Specify the alignment to center, ‘left’ will move the elements to the right of center to left justify, ‘right’ will move the elements to the left of center to right justify and ‘center’ will center the text.
- Position: Specify the overlay position relative to the feature bounding box. X and Y offset allow for the position to be fine-tuned.
- Include: Select to include the element in the overlay.
- Name: Select to include the element name in the overlay.
5. ID
Click a feature to identify its corresponding measurement in table
6. Save Image
Save Image allows you to save the current “color by measurements” image.
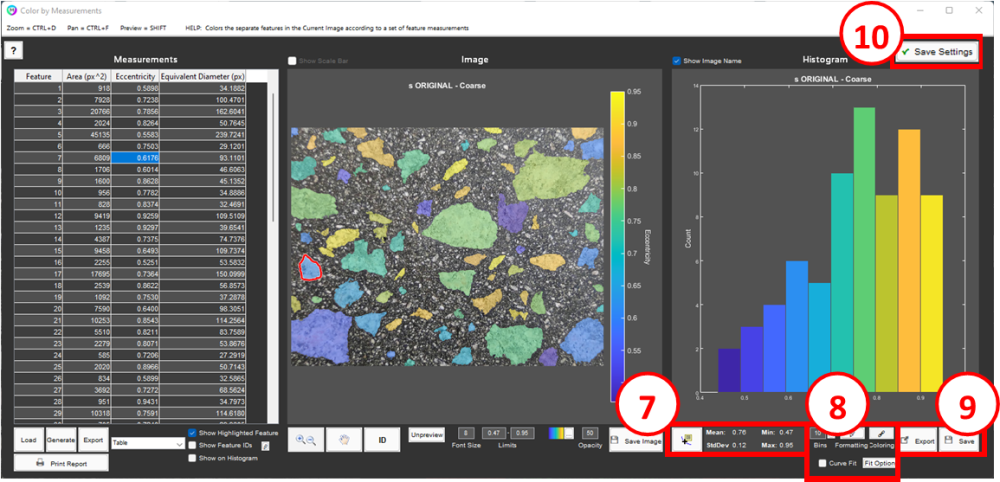
7. Measurement Stats
Displays the mean, standard deviation, min, and max of the selected measurements.
8. Histogram Display Settings
- Bins determines the number of bins to divide the histogram into. The default value is auto-calculated to provide an effective histogram shape. Typing in a new value sets a manual number of bins. Erase the typed in value anytime to revert back to the auto-calculated value. Click the ellipsis box next to “Bins” to manually set the limits of each bin.
- Click the pencil icon to show the X- and Y-axis limits, which can be edited by entering in the desired values.
- Coloring controls the color of histogram bars, either to be linked to the chosen colormap or to all be of a single chosen color.
- Add a Curve Fit by selecting any of the 3 fit types: Normal, Lognormal and Bimodal. Fit parameters are displayed by selecting the Fit Parameters button. These are automatically added to the Report Generator.
9. Export Data, Save Plot
- Export Data: Export histogram data to spreadsheet.
- Save Plot: Save plot as image.
10. Save Settings
If Color by Measurements is reached through the play button, then adjustments to display settings, such as selected column, image limits and coloring and histogram bins, limits, and coloring, will be saved into the recipe. The next time Color by Measurements is run on this measurement, these settings will be automatically used.
Tutorial
Need more help with this?
Chat with an expert now ››