In simple reports the contents of rows and columns are to an extent predefined and the Get Cell formulas return data based on specific definitions for each row or column.
For example the rows might contain variables (accounts) and each row of the template is for a particular variable.
However, using sets, it is possible to create reports where the end user can have some choice over what is displayed in the rows and/or columns.
Sets in Cubix are groupings of dimension members that are created as part of the original model design. Once created they can be used in browsers and reports to filter the data or to present it in a certain layout.
A common use of sets is to organise variables into groups such as P&L accounts, Balance Sheet accounts and Cash Flow accounts.
A set based report allows the end user to select which set (or sets) to use on the report. This could be one report in which the user can choose from different account layouts. Perhaps a summarised versus a detailed profit & loss statement or different layouts to reflect different accounting standards.
The design of a set based report is very similar to a simple member based report, except that we use set names and index numbers to determine which items to display.
Consider the following example.
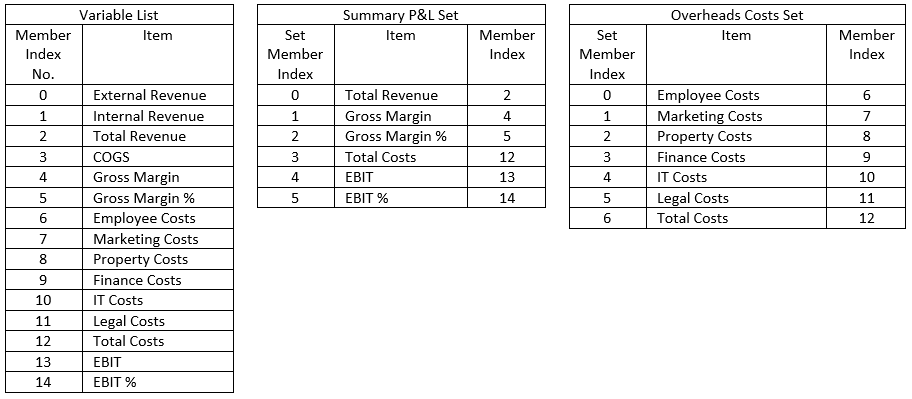
The table below shows a list of variables as defined in a Cubix model alongside two variable sets.
The variable list shows all the variable items and their member index number (position) in the master list. The two set lists show the variable items that have been selected for that set, their set member index number, i.e. their position in that set and their member index number.
Set based reports are designed such that the first item shown is the first item in the set, the second item shown is the second item in the set and so on, regardless of which set has been selected. Using a combination of formulas it is then possible to get the real index number for each item in the set and therefore use that to only display the items that are included in the set.
Using the example above, if the Summary P&L Set was selected, the report would show the items with member index numbers 2,4,5,12,13 and 14 in the first 6 rows of the report, whereas if the Overheads Costs Set was chosen, the report would show the items with index numbers 6,7,8,9,10 and 11 in the first 6 rows of the report.
The key functions used in set based reports are:
- TCM_SetMemberIndex – to return the member index number of each item in the set
- TCM_MemberName – to return the member name from the index number
- TCM_MemberDescription – to return the member description from either the index number or name.
Example Set Based Report Setup
Fixed Layout Reports versus Set Based Reports
| Fixed Layout Reports | Set Based Reports |
|---|---|
| Can be very simple to create | Slightly more complex to set up |
| May require maintenance when new dimension members are added in Cubix | Limited maintenance needed if new dimension members are added to Cubix sets appropriately |
| Very flexible layout. Any value can be placed in any spreadsheet cell | Can be very dynamic, but are based on list of items |
| Page breaks and print layouts can be fixed to provide consistent printed output | May require additional formatting to manage the display of sets of different sizes |


Post your comment on this topic.