
Once you have the browser displayed on your Excel worksheet, you can change the layout and contents by double clicking on certain cells.
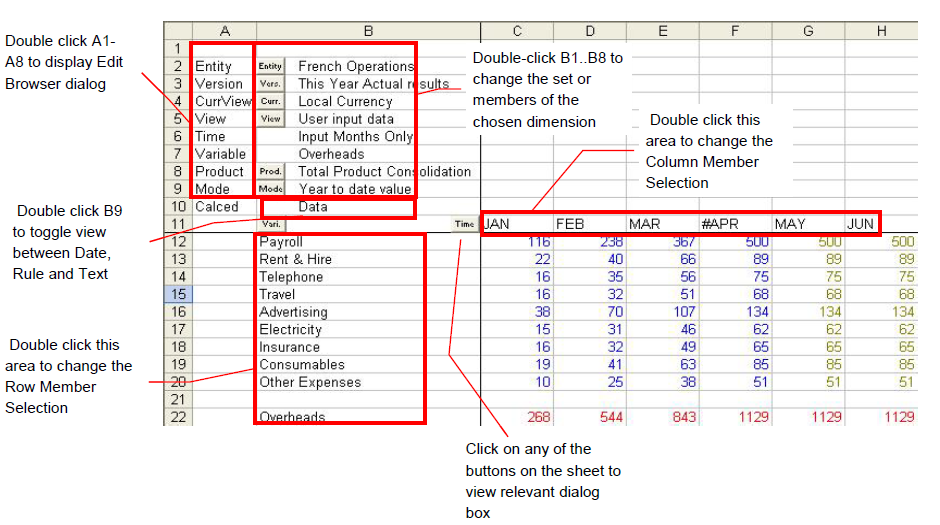
- Double clicking on any of the dimension names in column A will open the original Edit Browser window.
- Double clicking on any of the current selected members in column B will open the Member Selection window for that dimension. You can choose another member to change your browser contents.
- Double clicking on any of the row member descriptions in column B will open the Member Selection window for the rows.
- Double clicking on any of the column member names in row 11 will open the Member Selection window for the columns.
- Double clicking on the word Data in cell B9 will change the display to show either the data values, the names of any applied calculation rules or any stored text.

These windows to allow changes to the browser can also be opened directly from the Cubix menu. Use the Edit Browser, Row Members, Column Members and Fixed Members options as appropriate.
Colour Coding of Browser Data
You may notice as you change your browser views, that the data values displayed can have different colours. Cubix uses colour coding to identify the type of value being displayed as follows:
| Colour | Meaning |
|---|---|
| Black | Consolidated Values |
| Red | Calculated Values |
| Blue | Input Values |
| Purple | Intercompany Values |
| Green | Profile Values (forecasting) |
| Yellow | Empty cells |
Post your comment on this topic.