
Measurements > Local Measurements
Generates and visualizes measurements from individual pixels in the image.
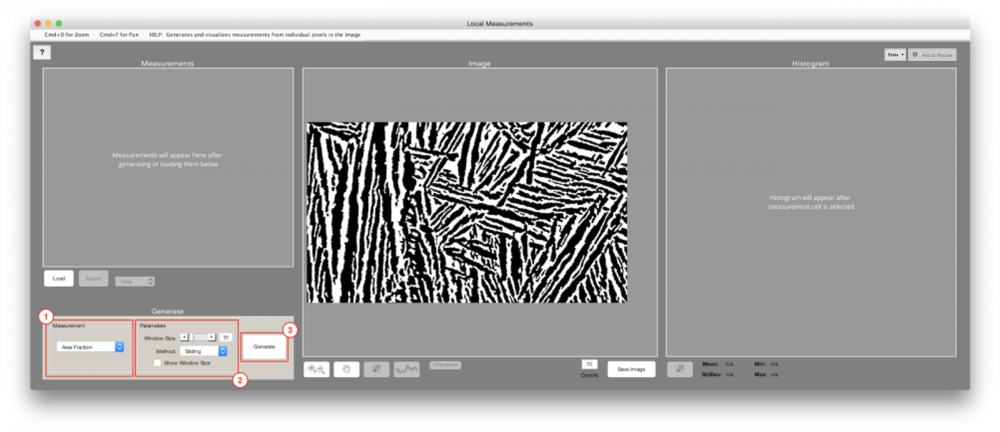
1. Measurement
Select the following types of measurements you would like to see visualized in the image.
- Anisotropy: Measures the amount of local directionality of features at each pixel in the image, with 0 being completely random in direction and 1 being highly directional
- Area Fraction: Measures the local area fraction of selected features at each pixel in the image
- Step Size: Determines the steps to take between measured pixels. Measurements for pixels in between are interpolated
- Count: Measures the number of features around each pixel
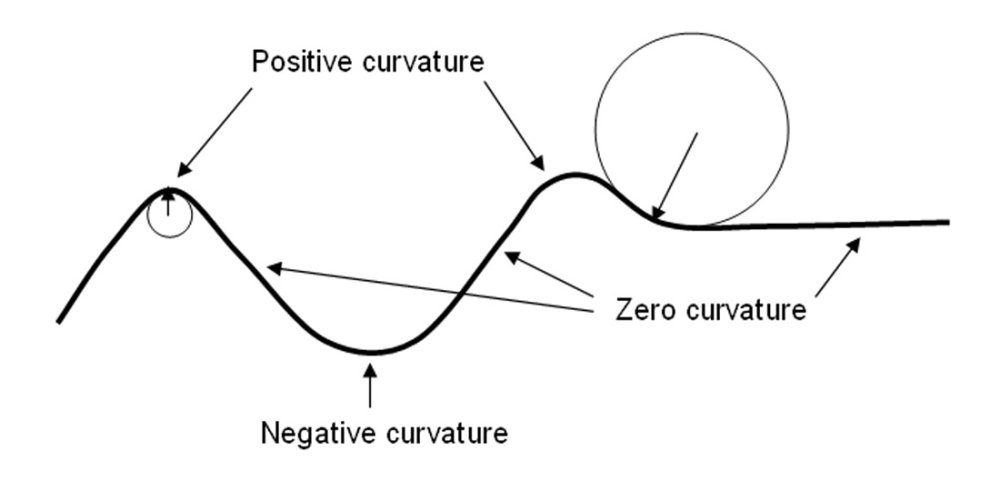
- Curvature: Generates the local curvature of the feature perimeter by fitting a circle at each pixel. [1]
- Smoothing: The smoothing determines the “search radius” (in pixels) about each pixel on the perimeter which is used to find pixels to fit a circle to. Larger smoothing values will results in more gradual transitions between curvatures along the perimeter, but may prevent very high curvatures from being measured properly.
- Method: Local curvature measurements are made at each pixel along the features’ skeleton. The algorithm which calculates this skeleton can be selected here.
- Perimeter: Local curvature measurement is made along the perimeter of the features
- Skeleton: Local curvature measurement is made along the skeleton of the features
- Number Density: Measures the number of features per unit area around each pixel
- Thickness: Measures the local thickness along features by measuring the diameter of the largest circle that can fit inside a feature with the center of the circle at each point along the feature’s skeleton
- Trim Thresh: The trim threshold determines the minimum length (in pixels) that all skeleton branches must be. Any branches below this length will be removed. This can be useful for removing small branches in the corners of features which do not represent pixels that one wishes to measure for thickness. Setting this threshold will cause the skeleton to be adjusted; however, the measurements themselves will not be re-calculated until the user clicks “Generate”.
- Method: Local thickness measurements are made at each pixel along the features’ skeleton. The algorithm which calculates this skeleton can be selected here.
- Advanced: Uses morphological thinning to produce skeletons typically with fewer branches. Often leads to more accurate thickness measurements.
- Smooth: Uses morphological thinning to produce skeletons typically with very few branches. Generates continuous skeletons best used for curved features.
- Classic: Uses traditional skeletonization to produce skeletons typically with more branches. However, in the case of very simple shapes, this method can produce slightly longer skeletons such that more desired pixels are measured than with the advanced method.
- Fit to Major: Draws lines along the major axes of all features. This is the recommend method for measuring local thickness, parallel to the thinnest dimension, along a single, or a just few, feature(s) (e.g., a layer of some sort) in the image. This method avoids branches that can occur near image edges when using the “Advanced” and “Classic” methods.
- Fit to Minor: Draws lines along the minor axes of all features. This is the recommend method for measuring local thickness, parallel to the thickest dimension, along a single, or a just few, feature(s) (e.g., a layer of some sort) in the image. This method avoids branches that can occur near image edges when using the “Advanced” and “Classic” methods.
- Orientation: Measures the local orientation of features at each pixel in the image from – 90 degrees to + 90 degrees
- * Intensity Mean: Requires that a grayscale Companion Image be set earlier in the Recipe. Measures the local average grayscale intensity at each pixel within the features. The measured grayscale intensities come from the latest set Companion Image.
- * Intensity StdDev: Requires that a grayscale Companion Image be set earlier in the Recipe. Measures the local standard deviation in grayscale intensity at each pixel within the features. The measured grayscale intensities come from the latest set Companion Image.
- * Nearest Distance: Requires that a B/W Companion Image be set earlier in the Recipe. Measures the the distance between each feature’s pixel and the nearest feature pixel from the latest set Companion Image.
Shared Parameters
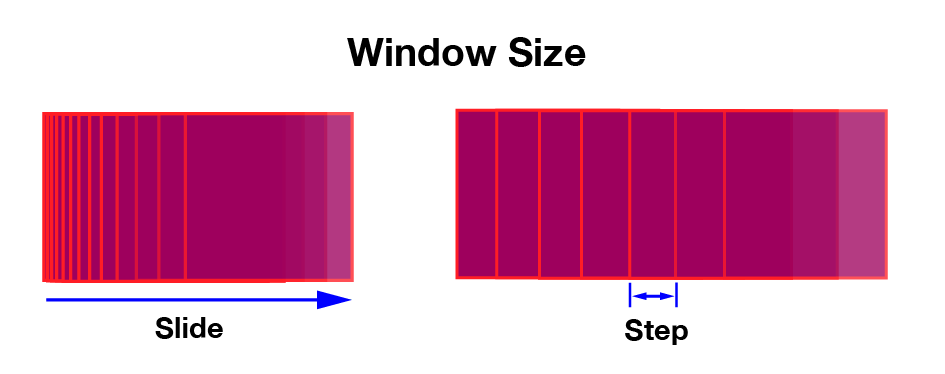
- Window Size: For Anisotropy, Area Fraction, Count, Number Density, Orientation, Intensity Mean, and Intensity StdDev the window size can be adjusted. The window size determines the number of pixels that will be used to calculate a measurement value for each pixel.
- Method: For ,Area Fraction, Count, Number Density, Intensity Mean, and Intensity StdDev the method can be selected. Sets the method for window translation across the image. Options are Sliding (Slide) or Blocks (Step).
- Speed: For Orientation and Anisotropy the speed can be adjusted. Speed controls the speed vs precision tradeoff. Higher speed settings use more downsampling on the image prior to map calculation.
3. Generate
- Generate measurements with the current settings and print them in the table on the left
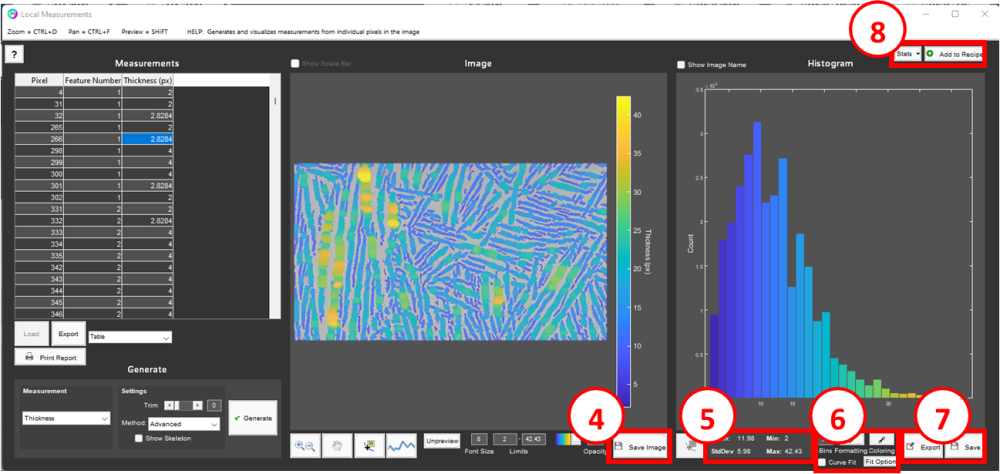
4. Save Image
- Save image anywhere on your computer.
5. Measurement Stats
Displays the mean, standard deviation, min, and max of the selected measurements.
6. Histogram Parameters
- Determines the number of bins to divide the histogram into. The default value is auto-calculated to provide an effective histogram shape. Typing in a new value sets a manual number of bins. Erase the typed in value anytime to revert back to the auto-calculated value.
- Edit bin limits, font size etc
- Add a Curve Fit by selecting any of the 3 fit types: Normal, Lognormal and Bimodal. Fit parameters are displayed by selecting the Fit Parameters button. These are automatically added to the Report Generator.
7. Export Data, Save Plot
- Export Data: Export histogram data to spreadsheet.
- Save Plot: Save plot as image.
8. Add to Recipe
- Add to Recipe: Add local measurement as step to recipe. Measurement and format settings will be preserved and recalled when step is played from recipe.
- Stats: Summary statistics to add to the recipe, which will appear in the global measurement report. Options are Mean, Min, Max, Median, Standard Deviation, and Sum.
References
- Bravo, L., & Aldana, M. (2010). Volume curvature attributes to identify subtle faults and fractures in carbonate reservoirs: Cimarrona Formation, Middle Magdalena Valley Basin, Colombia. SEG Technical Program Expanded Abstracts 2010. doi:10.1190/1.3513293
Tutorial
Need more help with this?
Chat with an expert now ››
Copyright © 2024 MIPAR
—
Powered by 