
Tables and Charts are visual presentation. They permit rapid access to and relatively easy comparison of information. Adding this graphic representation of data / value into the narrative report is simply easy.
1. Choose the source file in the data source manager drop-down. File not in the drop-down? click here

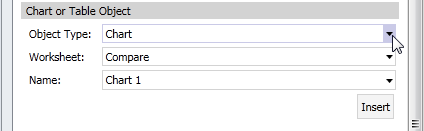
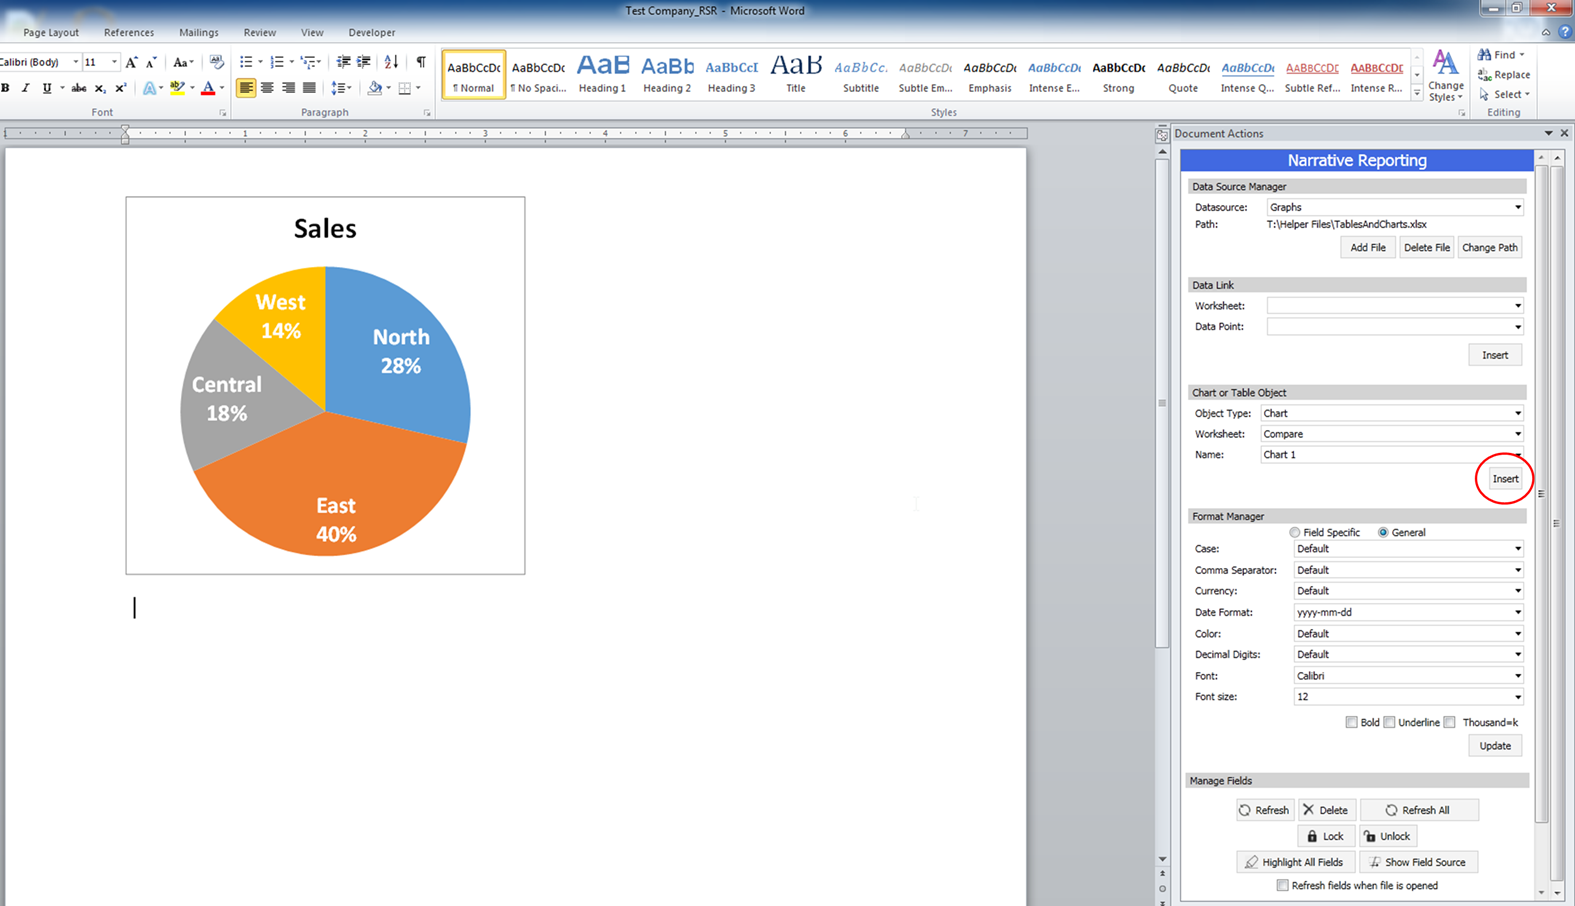
2. Select the type, worksheet and file name in the Chart or Table section of the narrative reporting tool.
3. Click insert button. The chart will be inserted into your report like shown here.
Feedback
Copyright © 2025 Solvency II Solutions
—
Powered by 
Post your comment on this topic.