
Analytics output feature:

There are six dashboards and reports, all of which include trend analysis. User can include all reports or filter generated report by selecting just some of the reports to be generated (note, if no of reports will be selected Generate report button will be disabled).
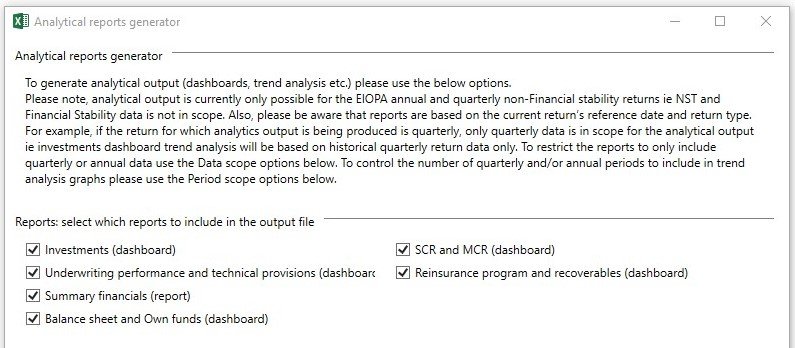
CONFIGURATIONS
Data Scope is selected by default and based on current return and can’t be modified ( in case current return is annual then by default Data Scope Include annual return data will be selected), as well both couldn’t be selected at the same time. Generally means, unless a quarterly reporting exemption is held, that investments dashboard should be generated from quarterly return and SCR dashboard should be generated from annual return.

Period scope Here user can select how many historical periods will be included in the report.

Output location folder of the generated report by default set to subfolder of the return, but can be changed anytime.

After click on Generate button report will be generated as a separate workbook. Each time user generates report a new output file is generated.
USER NOTES
- Charts in Excel 2010, NST and FSR data are currently not in scope
- Reports are a single-entity level (ie not group vs subsidiary allocation reports, PCC vs Cells/Core reports)
Post your comment on this topic.