
Different companies have different requirements to generate documents such as company returns and other reports. This means each company return or report requires a lot of information to complete. This information varies depending on the nature of the company.
To avoid having a large volume of data in a single window, Tabular provides a systematic and organised way of presenting reports with the use of Tabs (fig.below). In each Tab, sets of related documents can be grouped and categorised together in a single worksheet called QRT or Quantitative Reporting Template. Tabs make the reports “clutter-free” and saves user from browsing and scrolling. Plus they also have a chance to review and make updates on the data at a later time if necessary.
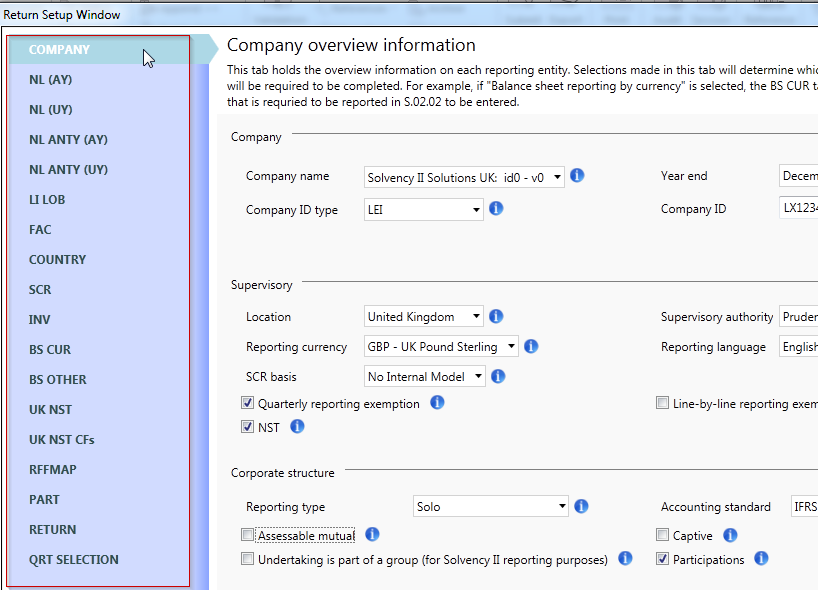
Click the following sub-sections to see the different Tabs for creating a return in Tabular.
Post your comment on this topic.